About the Elderly & Disabled Services in South Carolina Market Research Report
What’s Included in the Elderly & Disabled Services in South Carolina Market Research Report
Definition of the Elderly & Disabled Services in South Carolina?
This industry provides outpatient social assistance services to improve the quality of life for older adults and persons with intellectual and/or developmental disabilities. The services provide for the welfare of these individuals in areas characterized as day care, non-medical home care or homemaker services, social activities, group support and companionship.
What’s included in the Elderly & Disabled Services in South Carolina?
The Elderly & Disabled Services in South Carolina includes non-medical home aid services, social assistance and government contributions, gifts and grants and revenue. Related terms covered in the Elderly & Disabled Services in South Carolina industry report includes in medicaid, hcbs, home‑ and community‑based services, (often called medicaid home care) is an umbrella term for a wide range of medical and non‑medical services, including personal care (help with bathing, dressing, eating and household tasks), adult day services, home‑delivered meals, non‑medical transportation, supported employment and various in‑home supports delivered either through the state plan or waivers like 1915(c), 1915(i), 1915(j) and 1915(k) that allow states to waive rules to expand who can get services. the core policy goal is to give beneficiaries the option to receive the long‑term care they need in the least restrictive setting while maintaining autonomy and community participation, according to the cdc's national post-acute and long-term care study (npals), an adsc is a community-based center, generally open on weekdays, that provides long-term and post-acute care services to adults who require supervised care during the day or who are isolated and at risk of social isolation. these centers serve older and younger adults with disabilities, providing health and social services in professionally staffed group settings, nic map stands for national investment center market analysis & planning. it is a web-based data and analytics platform and the official strategic data partner of nic (national investment center for seniors housing & care), a 501(c)(3) nonprofit, operating under the brand name nic map vision, care for a chronic condition, trauma or illness that limits a person's ability to carry out basic self-care tasks, called activities of daily living (adls). medicaid covers some long-term services and supports (ltss). ltss includes medical and personal care services that aid in daily and instrumental activities for aging, chronic illness, or disability, provided through nursing facilities, adult day care, home aides and more, a social insurance program administered by the us government, providing health insurance coverage to people who are aged 65 and over and to those who are physically disabled, insurance covers approximately 80.0 million low-income americans (kff, 2024), accounting for one-sixth of healthcare spending and half of long-term care costs. jointly funded by states and the federal government, medicaid exhibits significant variations in expenditure and coverage a result of state-level policy flexibility, a person born during the birth boom between 1946 and 1964 and anyone who assists someone else who is, to some degree, incapacitated and needs help performing the daily tasks essential to living a normal life.
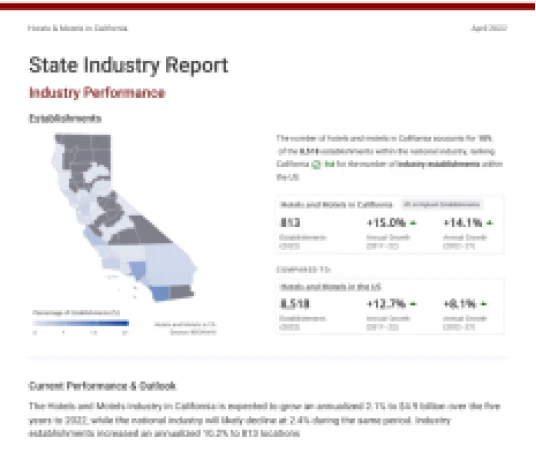
Industry Performance of the Elderly & Disabled Services industry in South Carolina
Benchmark the Elderly & Disabled Services in South Carolina industry performance with all SC county and national performance.
Elderly & Disabled Services in South Carolina
#26 in Highest Revenue 0.9% of state's GDPRevenue (2026)
Annual Growth (2021-26)
Annual Growth (2026-31)
Elderly & Disabled Services in the US
Revenue (2026)
Annual Growth (2021-26)
Annual Growth (2026-31)
For the full list of industry drivers, see report purchase options.
Key Drivers of the Elderly & Disabled Services industry in South Carolina
See how key industry drivers, such as population, net migration, per capita disposable income, number of adults aged 65 and older, number of people with private health insurance and federal funding for medicare and medicaid are impacting Elderly & Disabled Services in South Carolina
South Carolina Economic Indicators
Population
Net Migration
Per Capita Disposable Income
View more economic information in SC State Economic profile
US Key External Drivers
Number of adults aged 65 and older
Number of people with private health insurance
Federal funding for Medicare and Medicaid
For the full list of industry drivers, see report purchase options.
County Data of the Elderly & Disabled Services industry in South Carolina
Access proprietary data on county in the Elderly & Disabled Services in South Carolina, such as Greenville County, Richland County and Charleston County. Data includes figures on revenue, establishments, employees and wages by counties.
Key Statistics of the Elderly & Disabled Services industry in South Carolina
Download 19 years of historical data and 5 years of projected performance.