About the Physical Therapists in Montana Market Research Report
What’s Included in the Physical Therapists in Montana Market Research Report
Definition of the Physical Therapists in Montana?
Therapists in this industry include independent health practitioners primarily engaged in outpatient services. These services include administering medically prescribed rehabilitation for patients with injuries or diseases affecting muscles, nerves, joints and bones; planning and administering educational, recreational and social activities designed to help patients or individuals with disabilities; and diagnosing and treating speech, language, or hearing problems.
What’s included in the Physical Therapists in Montana?
The Physical Therapists in Montana includes treatment for neurological and sensory disorders, treatment for musculoskeletal and connective tissue conditions, treatement for mental health conditions and treatment related to other conditions. Related terms covered in the Physical Therapists in Montana industry report includes remote therapeutic monitoring (rtm) uses technology to track non-physiological data for therapy management and patient progress outside clinical settings, the merit-based incentive payment system (mips, 2017) is a federal medicare payment program that ties a clinician's reimbursement rate directly to their performance on quality and value measures with a single, unified scoring framework, where a physician, hospital or healthcare provider is paid a set amount for each enrolled patient per period, whether or not that patient seeks care, a healthcare profession focused on helping individuals develop, recover or maintain the skills needed for daily living and working, dysphagia is the medical term for difficulty swallowing, ranging from mild discomfort when moving food or liquid from the mouth to the stomach to a complete inability to swallow and the body’s system of muscles and bones, along with connective tissues like tendons, ligaments and cartilage, supports and binds these structures together.
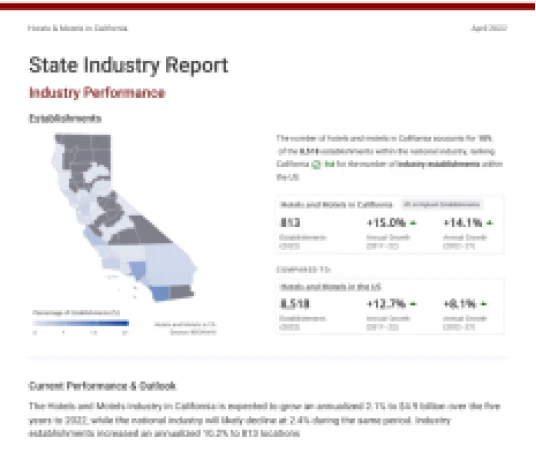
Industry Performance of the Physical Therapists industry in Montana
Benchmark the Physical Therapists in Montana industry performance with all MT county and national performance.
Physical Therapists in Montana
#44 in Highest Revenue 0.4% of state's GDPRevenue (2026)
Annual Growth (2021-26)
Annual Growth (2026-31)
Physical Therapists in the US
Revenue (2025)
Annual Growth (2020-25)
Annual Growth (2025-30)
For the full list of industry drivers, see report purchase options.
Key Drivers of the Physical Therapists industry in Montana
See how key industry drivers, such as population, gross state product, new business formation, number of people with private health insurance, per capita disposable income and federal funding for medicare and medicaid are impacting Physical Therapists in Montana
Montana Economic Indicators
Population
Gross State Product
New Business Formation
View more economic information in MT State Economic profile
US Key External Drivers
Number of people with private health insurance
Per capita disposable income
Federal funding for Medicare and Medicaid
For the full list of industry drivers, see report purchase options.
County Data of the Physical Therapists industry in Montana
Access proprietary data on county in the Physical Therapists in Montana, such as Gallatin County, Missoula County and Flathead County. Data includes figures on revenue, establishments, employees and wages by counties.
Key Statistics of the Physical Therapists industry in Montana
Download 19 years of historical data and 5 years of projected performance.