IBISWorld Platform
Answer any industry question in minutes with our entire database at your fingertips.

The S&P 500 is forecast to close 2026 at 7,922.2, up 15.7% for the year, marking a fourth consecutive annual gain as artificial intelligence (AI) continues to power corporate earnings. Chipmakers, cloud providers and software giants are reporting surging profits as businesses pour money into data centers and AI tools, pushing the index to repeated record closes. The 2025 tax legislation adds support, lifting after-tax earnings and freeing cash for share buybacks. Leadership remains narrow, however, with a handful of mega-cap technology stocks driving most of the index's gains. Rate pressures have also returned. The Federal Reserve raised interest rates in September as higher energy prices, linked to conflict in the Middle East, kept inflation stubbornly above target. Rising long-term Treasury yields are weighing on valuations, particularly for rate-sensitive sectors including real estate and utilities, keeping volatility elevated around inflation and jobs data.The S&P 500 has climbed at a compound annual rate of 10.7% over the five years through 2026, though the index endured a sharp correction before its rally took hold. Monetary policy set the tone early in the period. As inflation surged following Russia's invasion of Ukraine, the Federal Reserve launched its most aggressive tightening campaign in four decades, lifting borrowing costs and crushing valuations for growth stocks. The index fell into a bear market in 2022, with technology and communication services shares hit hardest.AI has driven the recovery. The launch of generative AI tools sparked an investment boom, as technology giants spent heavily on chips, cloud capacity and data centers. Nvidia, Microsoft and other mega-cap names posted outsized earnings gains, lifting the index to successive records in 2023 and 2024. That rally has made the index increasingly top-heavy, with the largest technology stocks accounting for a growing share of its market value.Trade policy has injected volatility. Sweeping reciprocal tariffs announced in April 2025 triggered a steep sell-off and a spike in market volatility, as investors priced in higher costs and slower growth. Subsequent tariff pauses and new trade agreements restored confidence, and the index rebounded to fresh records by year-end. Three Federal Reserve rate cuts in late 2025 and a strong earnings season extended those gains, setting the stage for continued growth in 2026.
Curious about what drives these trends? IBISWorld's analyst coverage on the s&p 500 includes detailled analysis on the current performance, outlook and industries affected.
1980-2032
The Standard & Poor's 500 stock index (S&P 500) is a commonly cited indicator of stock market performance. It is a float-adjusted, market capitalization-weighted index of 500 large-capitalization common stocks in the United States. The companies in the index operate across all sectors of the economy, including energy, financials, communication services, information technology, consumer discretionary and industrials. The values presented in this report are the December 31 close figures. Data is sourced from the St. Louis Federal Reserve.
IBISWorld Industry Reports are available in multiple formats to fit seamlessly into your workflow.
Answer any industry question in minutes with our entire database at your fingertips.
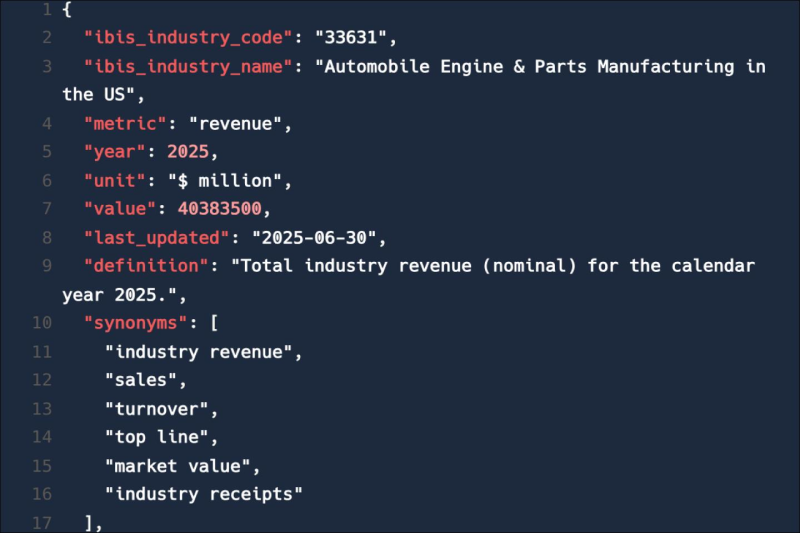
Feed trusted, human-driven industry intelligence straight into your platform.
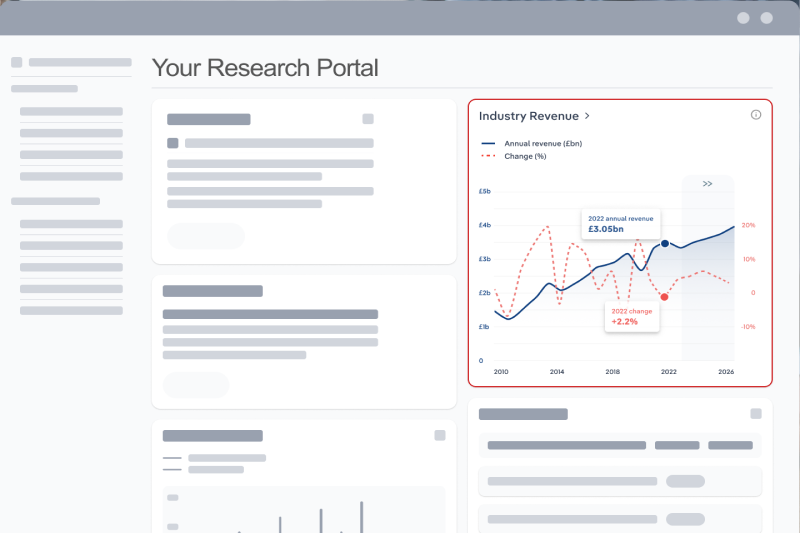
Streamline your workflow with IBISWorld’s intelligence built into your toolkit.
Explore industries with similar markets, supply chains, and economic drivers to gain broader context and insights.
When the stakes are high, you need intelligence that cuts through the noise—wherever you work.
The s&p 500 in the US in 2026 was 7,922.22 index points.
The s&p 500 in the US grew by 10.7% in 2026.
IBISWorld’s data and analysis on s&p 500 in the US includes forecasted growth rates over the next five years.