
IBISWorld Platform
Answer any industry question in minutes with our entire database at your fingertips.

The synthetic fiber PPI will climb to an estimated 167.6 in 2026, a 2.2% increase over 2025. This measured gain follows a stretch of considerable volatility, with prices settling after the outsized increases that marked the post-pandemic recovery. Manufacturers benefit from steadier supply chains, which ease some of the cost pressures tied to petrochemical feedstocks, since most synthetic fibers derive from petroleum-based inputs. Demand from textile producers and industrial users holds steady, supporting current price levels even as broader input costs moderate elsewhere in the supply chain. Competition from alternative materials and efficiency gains on the production side temper further increases, keeping growth in the low single digits despite firm underlying demand. Producers also benefit from a more predictable cost environment, as energy prices, a major input for synthetic fiber manufacturing, settle into a narrower trading range after several years of sharp swings. The synthetic fiber index jumped sharply through the early part of the five-year period, with a combined 25.0% rally in 2021 and 2022. Supply chain disruptions, energy cost inflation and raw material shortages push up petrochemical feedstock costs during this stretch, while pent-up consumer demand, supply chain bottlenecks and inventory restocking tied to the pandemic recovery drive fiber prices higher. Rising crude oil prices compound pressure on production costs, given synthetic fibers' reliance on petroleum-based derivatives, while transportation disruptions further strain logistics costs across the supply chain. Growth decelerated markedly after 2022, as easing supply chain pressures and moderating energy costs took hold. Trade tensions and tariffs continued to constrain raw material availability, while geopolitical uncertainty in energy markets kept some upward pressure on feedstock costs. Industry consolidation, marked by several plant closures and capacity adjustments, helps sustain pricing even as the pace of increases slows. The index demonstrated a compound annual rate of 2.9% across the five years to 2026, a much slower pace than the sharp gains recorded in 2021 and 2022. Overall, the period illustrates a market moving from acute, pandemic-driven cost pressure toward a steadier, more moderate pricing environment, with producers and buyers alike adjusting to a less volatile cost baseline by the end of the period.
Curious about what drives these trends? IBISWorld's analyst coverage on the producer price index: synthetic fiber includes detailled analysis on the current performance, outlook and industries affected.
1980-2032
The Price of Synthetic Fiber represents the Producer Price Index for synthetic fibers, measuring the average change in selling prices received by domestic producers for synthetic fiber materials. The index uses 1982 as the base year (100) and tracks price movements across various synthetic fiber categories including polyester, nylon, acrylic and other man-made fibers used in textile and industrial applications. Data is sourced from the US Bureau of Labor Statistics.
IBISWorld Industry Reports are available in multiple formats to fit seamlessly into your workflow.

Answer any industry question in minutes with our entire database at your fingertips.
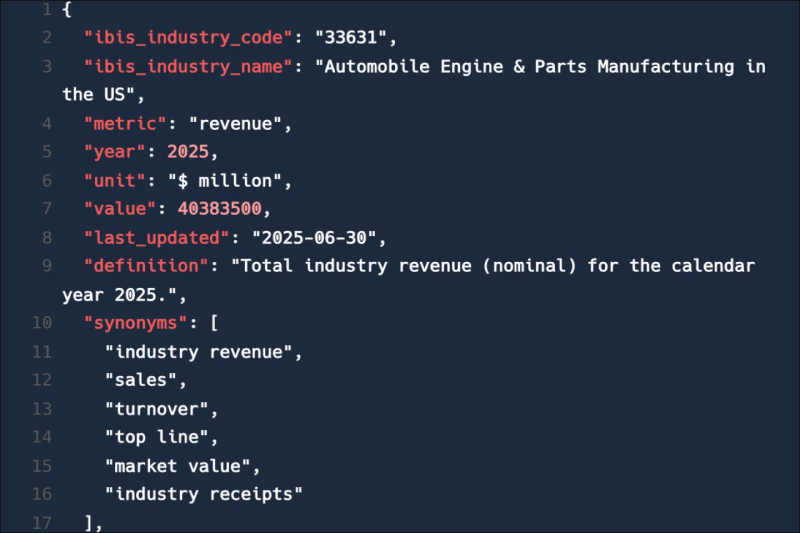
Feed trusted, human-driven industry intelligence straight into your platform.
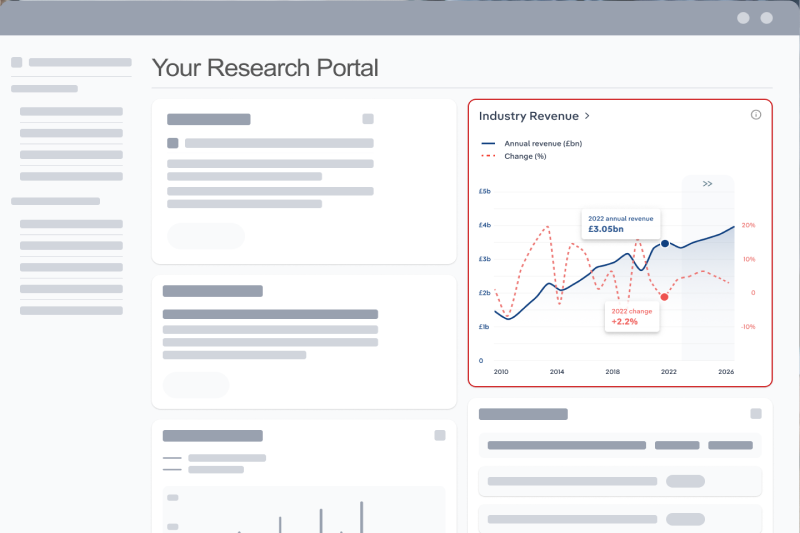
Streamline your workflow with IBISWorld’s intelligence built into your toolkit.
Explore industries with similar markets, supply chains, and economic drivers to gain broader context and insights.
| Industry | Country | Last 5-yr CAGR | Forecast 5-year CAGR | Revenue |
|---|---|---|---|---|
| Carpet Mills in the US |

|
XX% | XX% | $XX |
| Cotton Farming in the US |
|
XX% | XX% | $XX |
| Floor Covering Retailing in the US |
|
XX% | XX% | $XX |
| Blind & Shade Manufacturing in the US |
|
XX% | XX% | $XX |
| Commercial Embroidery Services in the US |
|
XX% | XX% | $XX |
| Synthetic Fiber Manufacturing in the US |
|
XX% | XX% | $XX |
| Wig & Hairpiece Stores in the US |
|
XX% | XX% | $XX |
| Tactical & Service Clothing Manufacturing in the US |
|
XX% | XX% | $XX |
When the stakes are high, you need intelligence that cuts through the noise—wherever you work.
The producer price index for synthetic fiber in the US in 2026 was 167.55 index points.
The producer price index for synthetic fiber in the US grew by 2.93% in 2026.
IBISWorld’s data and analysis on producer price index for synthetic fiber in the US includes forecasted growth rates over the next five years.