
IBISWorld Platform
Answer any industry question in minutes with our entire database at your fingertips.

In 2026, the price of fruit index is set to rise by an estimated 0.1%, reaching 170.3, as a moderating pace of growth reflects competing pressures. Higher fuel and shipping expenses, escalating farm labor costs, new tariffs on imported produce and localized weather-related supply issues are all pushing farm-gate prices for fresh fruit and melons higher. The intermittent war with Iran has driven up global oil prices at various points in 2026, lifting trucking and refrigerated freight costs that disproportionately affect fruit reliant on long, temperature-controlled supply chains, including berries and tropical fruit. A newer round of Section 301 tariffs targeting Brazil, Chile, Australia and other MERCOSUR-linked suppliers over agricultural labor practices is adding further price pressure on imported grapes, stone fruit and other specialty categories. Tight seasonal farm labor markets are pushing up harvesting and packing costs, while weather and water-cost issues in some growing regions are compounding pressures for stone fruit and specialty crops. However, stable, USMCA-preferential supply from Mexico and Canada is offsetting these upward pressures, keeping overall growth for the index modest rather than sharp. Over the five years through 2026, the price of fruit index has climbed at an estimated 3.1% CAGR, but nearly all of this growth was driven by sharp jumps in 2021 and 2022, reflecting an unusual convergence of pandemic-era disruptions, geopolitical shocks and evolving trade policy. The pandemic initially caused acute supply chain disruptions and product shortages just as consumer demand for fresh produce surged, driven by heightened health awareness and shifting at-home consumption habits, accelerating price growth from 2021 onward. In 2022, the index jumped 18.1%, as strong demand collided with global logistics bottlenecks, the conflict in Ukraine and a run of natural disasters that constrained production and transport capacity. These forces pushed up costs for fertilizer, energy and freight across the supply chain, creating persistent volatility before pressures eased and price momentum weakened in the years that followed. Trade policy has since become a larger swing factor. In November 2025, Washington exempted bananas, tropical fruit and coffee from earlier reciprocal tariffs, and separate framework deals lowered duties on Guatemalan and Ecuadorian produce. Guatemala and Peru have since gone further, striking their own bilateral free-trade pact, effective July 1, 2026, that cuts tariffs between the two countries. Imports from Mexico and Canada, meanwhile, have continued entering under USMCA preferential treatment, helping keep North American trade flows relatively stable even as tariffs on other partners intensified. At the same time, enduring shifts in consumer preferences toward healthier eating since the pandemic have sustained elevated demand for fresh fruit, influencing both prices and sourcing strategies. Overall, the price of fruit has shown moderate volatility relative to more energy-sensitive farm products over 2021-2026, with movements driven more by supply disruptions, household income shifts, adverse weather and evolving US trade policy than by direct fuel price linkages.
Curious about what drives these trends? IBISWorld's analyst coverage on the producer price index: fruit includes detailled analysis on the current performance, outlook and industries affected.
1980-2032
The price of fruit represents the prices received by farmers for their fresh fruit and melons. The annual figures presented in this report are equally weighted averages of the monthly means. Data is from the Bureau of Labor Statistics, with forecast growth rates sourced from the US Department of Agriculture (USDA).
IBISWorld Industry Reports are available in multiple formats to fit seamlessly into your workflow.

Answer any industry question in minutes with our entire database at your fingertips.
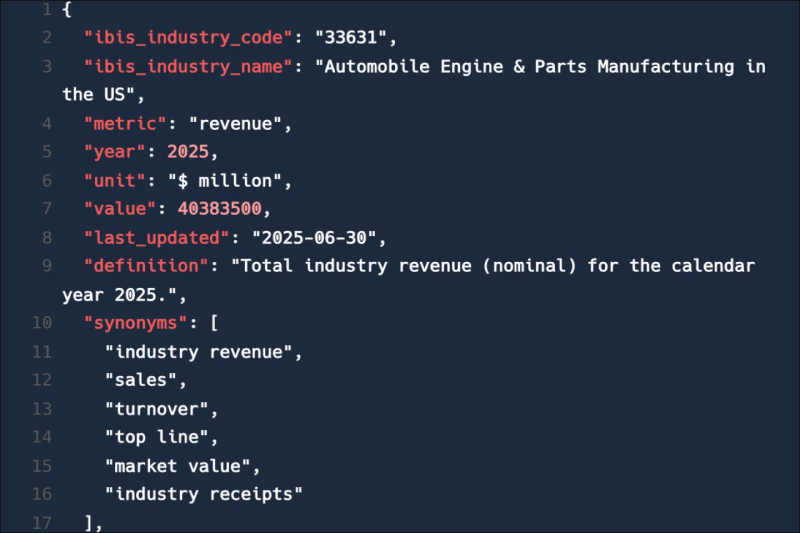
Feed trusted, human-driven industry intelligence straight into your platform.
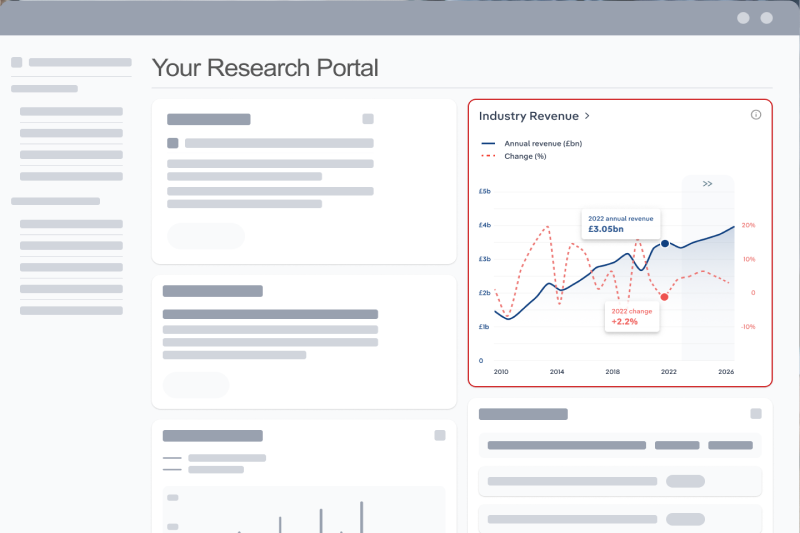
Streamline your workflow with IBISWorld’s intelligence built into your toolkit.
Explore industries with similar markets, supply chains, and economic drivers to gain broader context and insights.
| Industry | Country | Last 5-yr CAGR | Forecast 5-year CAGR | Revenue |
|---|---|---|---|---|
| Fruit & Nut Farming in the US |

|
XX% | XX% | $XX |
| Frozen Fruit & Juice Manufacturing in the US |
|
XX% | XX% | $XX |
| Canned Fruit & Vegetable Processing in the US |
|
XX% | XX% | $XX |
| Farmers Markets in the US |
|
XX% | XX% | $XX |
| Fruit & Vegetable Wholesaling in the US |
|
XX% | XX% | $XX |
| Juice & Smoothie Bars in the US |
|
XX% | XX% | $XX |
| Wineries in the US |
|
XX% | XX% | $XX |
| Dried Fruit & Vegetable Snack Production in the US |
|
XX% | XX% | $XX |
| Fruit & Vegetable Retailing in the US |
|
XX% | XX% | $XX |
When the stakes are high, you need intelligence that cuts through the noise—wherever you work.
The producer price index for fruit in the US in 2026 was 170.25 index points.
The producer price index for fruit in the US grew by 3.06% in 2026.
IBISWorld’s data and analysis on producer price index for fruit in the US includes forecasted growth rates over the next five years.