
IBISWorld Platform
Answer any industry question in minutes with our entire database at your fingertips.

In 2026, manufacturing capacity utilization is estimated at 76.1%, a 0.7 percentage point increase from the previous year. Factory activity has turned up after a prolonged slump, with new orders and production expanding through the year as interest rate cuts revived equipment spending and full expensing provisions pulled capital investment forward. Tariff protection has redirected demand toward domestic producers, lifting run rates across metals, machinery and transportation equipment. Gains have been uneven, though. Motor vehicle assembly has slipped, nondurable output has softened and duties on metals, copper and semiconductors have inflated input costs, keeping prices paid elevated for the better part of two years. Utilization remains well below its long-run average, leaving ample slack for manufacturers to absorb additional orders without commissioning new plants.From 2021 through 2026, capacity utilization decreased by -1.2 percentage point, falling relative to a sharp rebound in 2021, when MCU reached 77.3%. Rates climbed sharply through 2021 and peaked in 2022 as backlogged orders, inventory restocking and stretched supply chains pushed plants to run flat out. Semiconductor scarcity capped motor vehicle assembly during this stretch, yet strength across machinery, metals and aerospace more than compensated.The correction that followed was driven by inventories and interest rates. Manufacturers had over-ordered during the shortages and spent the following years drawing stocks back down, which suppressed production even where final demand held up. Monetary tightening then raised the cost of financing equipment and stalled orders for capital goods. The purchasing managers index sat below the expansion threshold for most of the period through late 2025, one of the longest stretches of contraction on record.Policy has pulled in both directions. The CHIPS Act and clean energy incentives triggered a wave of factory construction that enlarged the capital base, and because utilization measures output against available capacity, new plants coming online mechanically depressed the rate. Sweeping tariffs introduced in 2025 raised input costs, invited retaliation and froze investment decisions while firms waited for clarity on rules of origin and exemptions. Announced reshoring commitments have far outpaced completed construction, with factory building activity falling from its 2024 peak as electronics projects were deferred. Meanwhile, the fastest-growing sources of industrial demand, data centers and grid equipment, have channeled capital into construction and power rather than into factory floors.
Curious about what drives these trends? IBISWorld's analyst coverage on the manufacturing capacity utilization includes detailled analysis on the current performance, outlook and industries affected.
1980-2032
Manufacturing capacity utilization (MCU) is calculated as the ratio of actual manufacturing output to potential full capacity output. The higher the utilization rate, the less slack there is at plants to take on additional work. Consequently, high utilization rates are typically viewed as a leading indicator for rising inflation and higher long-term interest rates. The data for this report is sourced from the Federal Reserve. The values presented in this report are annual figures, derived from equally weighted monthly averages.
IBISWorld Industry Reports are available in multiple formats to fit seamlessly into your workflow.

Answer any industry question in minutes with our entire database at your fingertips.
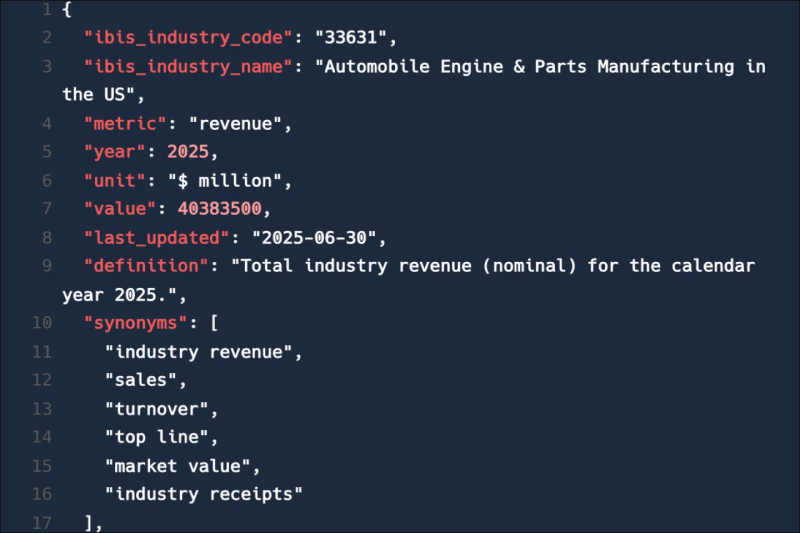
Feed trusted, human-driven industry intelligence straight into your platform.
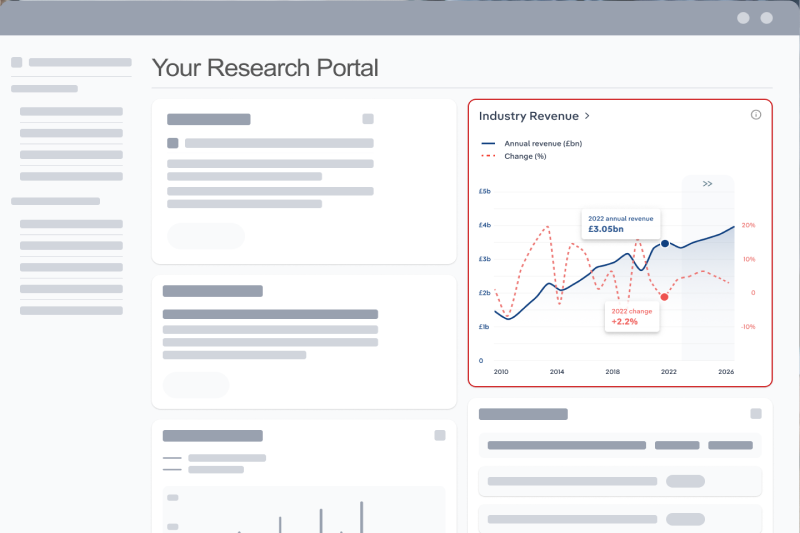
Streamline your workflow with IBISWorld’s intelligence built into your toolkit.
Explore industries with similar markets, supply chains, and economic drivers to gain broader context and insights.
When the stakes are high, you need intelligence that cuts through the noise—wherever you work.
The manufacturing capacity utilization in the US in 2026 was 76.07%.
The manufacturing capacity utilization in the US declined by -0.31% in 2026.
IBISWorld’s data and analysis on manufacturing capacity utilization in the US includes forecasted growth rates over the next five years.