
IBISWorld Platform
Answer any industry question in minutes with our entire database at your fingertips.

Inbound trips to the United States by non-US residents are projected to increase 3.2 percent in 2026, a partial recovery from 2025 when negative sentiment toward the country and a Canadian travel boycott produced the steepest drop in two decades outside the pandemic (NTTO, CNN). The FIFA World Cup and celebrations for the nation's 250th anniversary anchor the rebound, giving airlines and destinations reason to add capacity and marketing across host cities. The turnaround is narrower than it appears. Almost three-quarters of incremental volume comes from Mexico and Canada while overseas arrivals fell through the first half of the year, with major European and Asian markets tracking well below forecast. Expensive tickets, visa hurdles and disappointing hotel bookings blunted the tournament's boost, and stricter immigration enforcement continues to temper inflows.Over the five-year period ending in 2026, inbound trips grew at a 25.9% compound annual rate, albeit from an extremely low base in 2021. Inbound trips were defined by extreme volatility across the period. The return of global travel in 2021 was gradual and uneven as lingering restrictions and weak confidence held arrival volumes far below pre-pandemic benchmarks. Volumes more than doubled in 2022 as entry rules loosened and pent-up demand was released, marking the fastest growth of the period. Capacity was capped by consular backlogs, with first-time visitor visa applicants in several top markets facing average interview waits beyond a year. Growth stayed rapid through 2023 as China lifted its ban on outbound group tours to the United States. Faster visa processing, better affordability and restored airline networks lifted arrivals again in 2024, though the recovery remained incomplete and volumes stayed below the 2019 peak.The period's defining deviation came in 2025, when arrivals fell even as global travel set records. Tariffs and annexation rhetoric triggered a sustained Canadian boycott that cut cross-border trips sharply, and Canada alone accounted for most of the national decline. Policy layered on further friction. An entry suspension covering nineteen countries took effect in mid-2025 and was expanded at the start of 2026, authorization fees for visa waiver travelers nearly doubled, a new visa integrity charge raised the cost of a tourist visa substantially, online presence screening was extended to more applicant categories and federal destination marketing funding was cut by four-fifths. A weaker dollar improved value for foreign visitors but could not offset reputational damage.
Curious about what drives these trends? IBISWorld's analyst coverage on the inbound trips by non-us residents includes detailled analysis on the current performance, outlook and industries affected.
2000-2032
This report tracks the number of foreign arrivals into the United States for leisure and business. The data is sourced from the International Visitation to the United States report compiled by the Office of Travel and Tourism Industries in conjunction with the US Department of Commerce.
IBISWorld Industry Reports are available in multiple formats to fit seamlessly into your workflow.
Answer any industry question in minutes with our entire database at your fingertips.
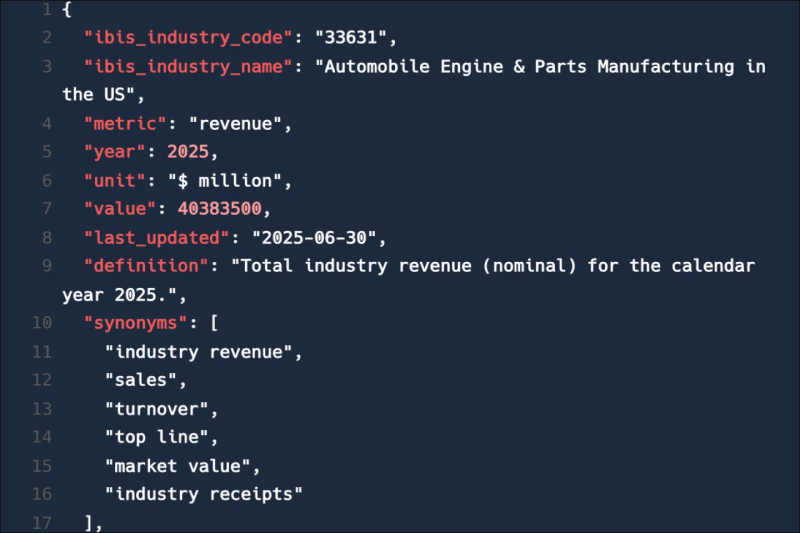
Feed trusted, human-driven industry intelligence straight into your platform.
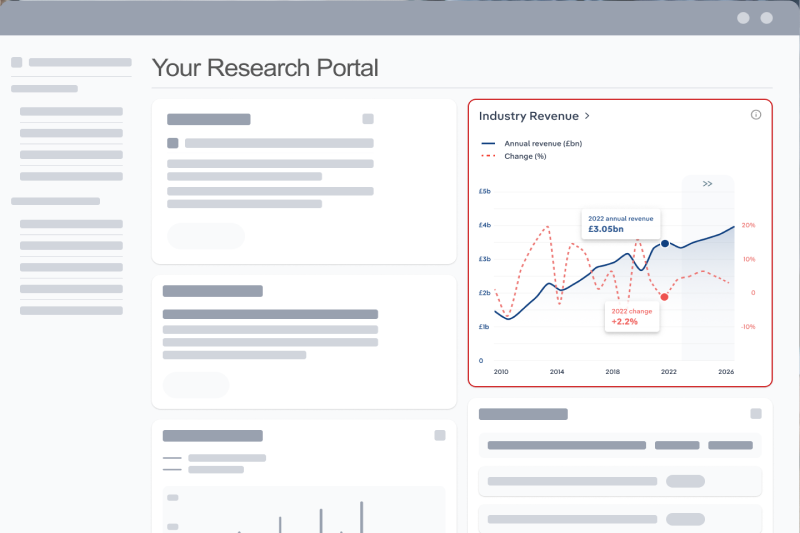
Streamline your workflow with IBISWorld’s intelligence built into your toolkit.
Explore industries with similar markets, supply chains, and economic drivers to gain broader context and insights.
When the stakes are high, you need intelligence that cuts through the noise—wherever you work.
The inbound trips by non-us residents in the US in 2026 was 70.47 million.
The inbound trips by non-us residents in the US grew by 25.9% in 2026.
IBISWorld’s data and analysis on inbound trips by non-us residents in the US includes forecasted growth rates over the next five years.