
IBISWorld Platform
Answer any industry question in minutes with our entire database at your fingertips.

IBISWorld forecasts the electricity service price index to rise by 3.1% in 2026-27, to 1,000.0 index points. Network charges remain the primary source of upward pressure, with 1 April 2026 marking the second pricing year of the Commerce Commission's fourth Default Price-Quality Path (DPP4) for electricity distribution businesses. According to the Commerce Commission, distribution and transmission costs together make up just over 30% of the average power bill. These costs have been rising since 2025 and are slated to trend upwards until 2030. The Electricity Authority reported that power bills for New Zealand households and small businesses increased by an average of 6.8% in the first half of 2026, driven mostly by higher lines charges, following an 8% increase in 2025, although larger commercial consumers will have experienced a different outcome. Working in the opposite direction, the sharp fall in wholesale and forward prices has been reflected in commercial contracts. Domestic electricity prices in New Zealand are often relatively insulated from global trends, as over 80% of the country's electricity generation comes from renewable sources. Hydroelectricity is typically New Zealand's largest generation source, which makes the system highly sensitive to hydro-storage conditions. As a result, the supply and price of electricity can be significantly affected by changes in the volume of water stored in hydroelectric reservoirs. Despite New Zealand's strong reliance on local renewables, global factors can still influence electricity prices.The electricity service price index has fluctuated over the five years to 2026-27, reflecting New Zealand's exposure to global energy market disruptions and domestic supply constraints. The price rose during 2021-22 as electricity demand recovered from pandemic-induced lockdowns, with the onset of the Russia-Ukraine conflict in February 2022 lifting international coal and gas prices towards the end of the year. Despite New Zealand generating over 80% of its electricity from renewable sources, the country relies on gas and coal for backup generation during dry periods. Yet, in 2022-23, these trends reversed, and prices plummeted. Higher inflows lifted storage volumes in New Zealand's hydro lakes, which depressed spot-market prices and eased the cost of electricity to commercial customers as contracts repriced.This reprieve proved short-lived, with the index climbing sharply during 2023-24 and 2024-25. This spike was largely driven by low hydropower generation, the country's main electricity source. Dry conditions associated with El Niño weather patterns in the Pacific Ocean contributed to low hydro-storage conditions, diminishing the ability of hydro generation to meet New Zealand's energy demand. Natural gas shortages also contributed to the decline in electricity supply, pushing up electricity prices. The index then rose a further 7.4% in 2025-26 as the DPP4 reset took effect, with the increase to regulated network revenue more than offsetting the sharp fall in wholesale prices over the same period. Overall, IBISWorld expects the electricity service price index to increase over the five years through to 2026-27, at a compound annual rate of 3.9%.
Curious about what drives these trends? IBISWorld's analyst coverage on the electricity service price index includes detailled analysis on the current performance, outlook and industries affected.
2007-2034
This report analyses the price paid by commercial consumers to acquire electricity. The data for this report is sourced from Stats NZ (Tatauranga Aotearoa). The historical data for this report use the average quarterly index value for each financial year and are measured in index points. The electricity service price is presented as an index, with 2026-27 as the base year, and all historical and forecast values are rebased on the same basis so that year-on-year movements are directly comparable across the series.
IBISWorld Industry Reports are available in multiple formats to fit seamlessly into your workflow.

Answer any industry question in minutes with our entire database at your fingertips.
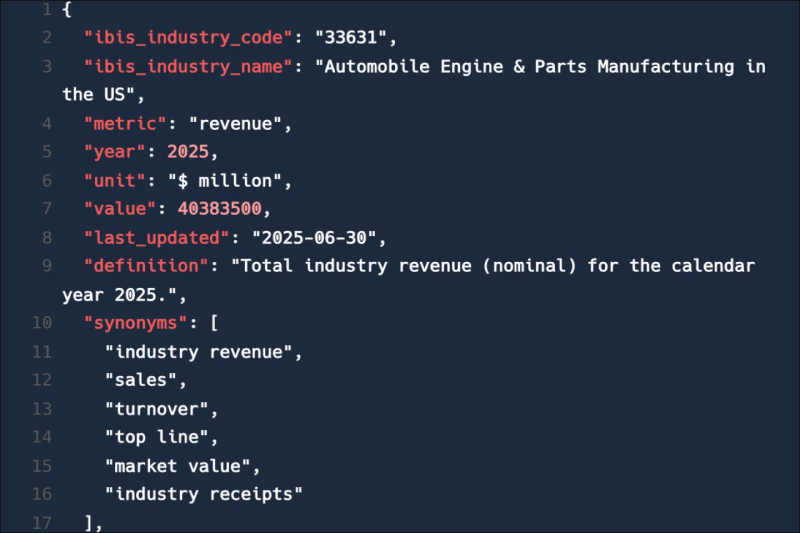
Feed trusted, human-driven industry intelligence straight into your platform.
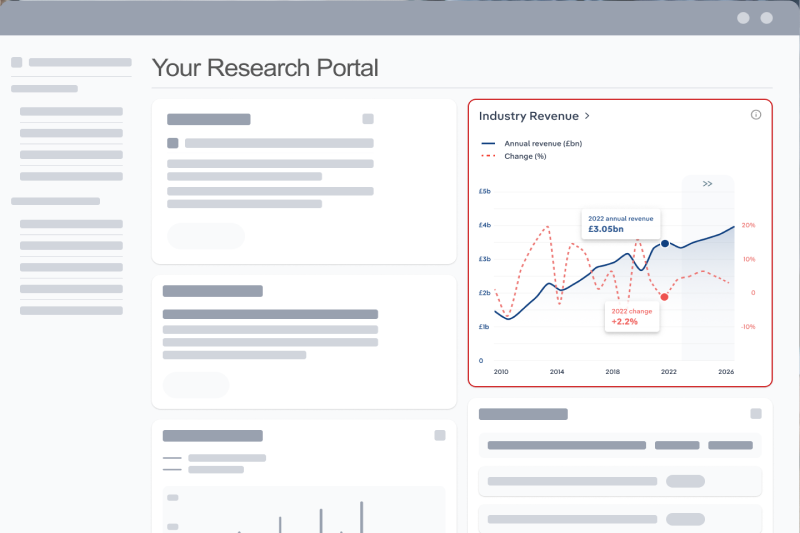
Streamline your workflow with IBISWorld’s intelligence built into your toolkit.
Explore industries with similar markets, supply chains, and economic drivers to gain broader context and insights.
| Industry | Country | Last 5-yr CAGR | Forecast 5-year CAGR | Revenue |
|---|---|---|---|---|
| Gas Supply in New Zealand |

|
XX% | XX% | $XX |
| Nonferrous Metal Product Manufacturing in New Zealand |
|
XX% | XX% | $XX |
| Electricity Transmission & Distribution in New Zealand |
|
XX% | XX% | $XX |
When the stakes are high, you need intelligence that cuts through the noise—wherever you work.
The electricity service price index in New Zealand in 2027 was 1,000 index points.
The electricity service price index in New Zealand grew by 3.86% in 2027.
IBISWorld’s data and analysis on electricity service price index in New Zealand includes forecasted growth rates over the next five years.