Industry Statistics and Rankings
How does this industry perform in Italy compared to Europe?
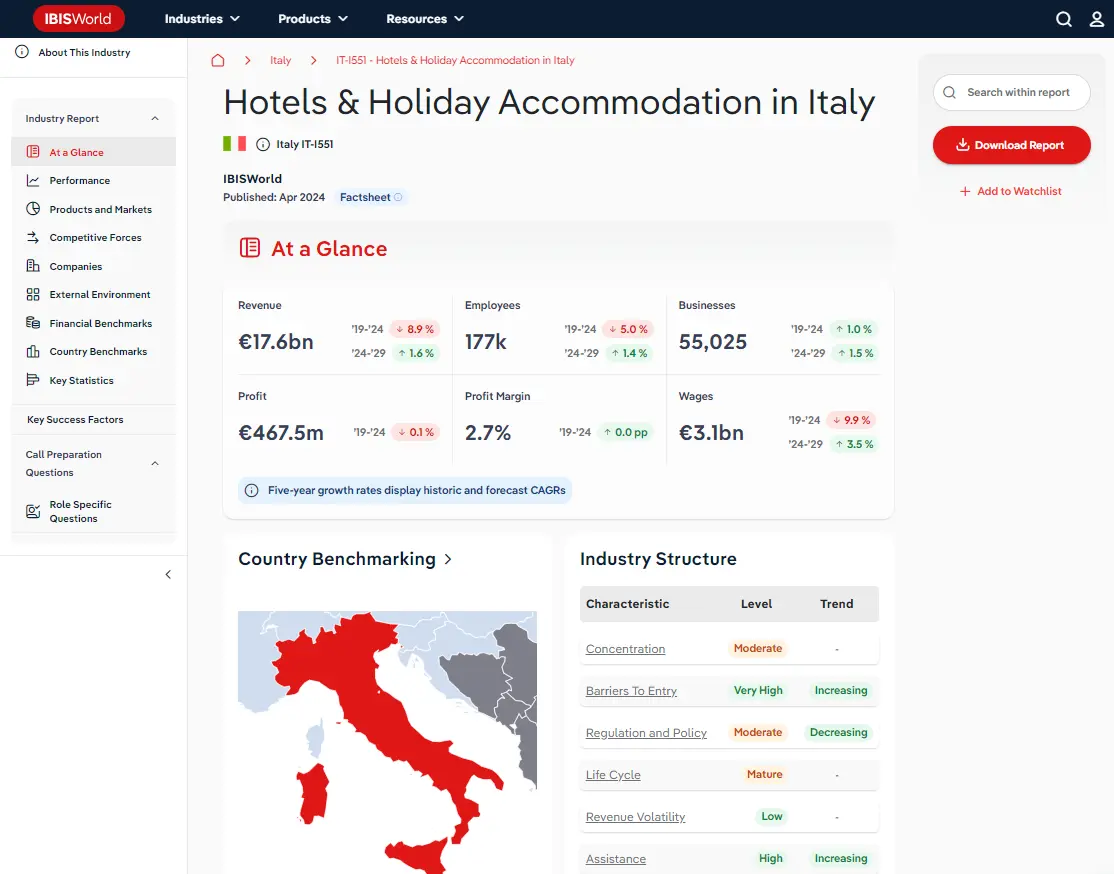
Country Benchmarking
Industry Data Italy
Ranking are out of 37 European countries for which IBISWorld provides country-level factsheets.
Revenue
#10 In EuropeBusiness
#4 In EuropeEmployees
#7 In EuropeWages
#11 In EuropeCompanies operating in the third-party real estate industry have had to navigate numerous economic headwinds in recent years, ranging from rising interest rates, spiralling inflation and muted economic growth. Revenue is projected to sink at a compound annual rate of 3.7% over the five years through 2024, including an estimated slump of 2.1% in 2024 to €196.2 billion, while the average industry profit margin is forecast to reach 34.6%.
Enterprises
Number of businesses in 2024
Biggest companies in the Third-Party Real Estate Activities in Italy
| Company | Market Share (%)
2024 | Revenue (€m)
2024 | Profit (€m)
2024 | Profit Margin (%)
2024 |
|---|---|---|---|---|
CBRE Group, Inc. | 33,483.5 | 1,632.1 | 4.9 | |
Jones Lang LaSalle Inc. | 20,548.1 | 1,032.5 | 5.0 | |
Savills plc | 2,934.1 | 251.6 | 8.6 |
Access statistics and analysis on all 10 companies with purchase. View purchase options.
Top Questions Answered in this Report
Unlock comprehensive answers and precise data upon purchase. View purchase options.
What is the market size of the Third-Party Real Estate Activities industry in Italy in 2024?
The market size of the Third-Party Real Estate Activities industry in Italy is €5.8bn in 2024.
How many businesses are there in the Third-Party Real Estate Activities in Italy industry in 2024?
There are 54,670 businesses in the Third-Party Real Estate Activities industry in Italy, which has grown at a CAGR of 1.8 % between 2019 and 2024.
Has the Third-Party Real Estate Activities industry in Italy grown or declined over the past 5 years?
The market size of the Third-Party Real Estate Activities industry in Italy has been declining at a CAGR of 1.8 % between 2019 and 2024.
What is the forecast growth of the Third-Party Real Estate Activities industry in Italy over the next 5 years?
Over the next five years, the Third-Party Real Estate Activities industry in Italy is expected to decline.
What are the biggest companies in the Third-Party Real Estate Activities market in Italy?
The biggest companies operating in the Third-Party Real Estate Activities market in Italy are CBRE Group, Inc., Jones Lang LaSalle Inc. and Savills plc
What does the Third-Party Real Estate Activities in Italy include?
Transaction and Administrative services are part of the Third-Party Real Estate Activities industry.
Which companies have the highest market share in the Third-Party Real Estate Activities in Italy?
The company holding the most market share in Italy is CBRE Group, Inc..
How competitive is the Third-Party Real Estate Activities industry in Italy?
The level of competition is moderate and increasing in the Third-Party Real Estate Activities industry in Italy.
Related Industries
This industry is covered in 37 countries
Domestic industries
Table of Contents
About this industry
Industry definition
Companies in this industry provide third-party real estate services. This involves external activities that support, complement, or are otherwise connected to the real estate industry, like estate agents.
Related Terms
ESCROWFiduciaryProptechWhat's included in this industry?
TransactionAdministrative servicesMaintenanceLettingTenant placementAncillaryCompanies
CBRE Group, Inc.Jones Lang LaSalle Inc.Savills plcIndustry Code
682 - Real estate activities on a fee or contract basis in Italy
View up to 10 companies with purchase. View purchase options.
Performance
Revenue Highlights
Trends
- Revenue
- 2024 Revenue CAGR
- Revenue Volatility
Employment Highlights
Trends
- Employees
- Employees per Business
- Revenue per Employee
Business Highlights
Trends
- Businesses
- Employees per Business
- Revenue per Business
Profit Highlights
Trends
- Total Profit
- Profit Margin
- Profit per Business
Current Performance
Charts
- Revenue
- Employees
- Business
- Profit
Analysis
What's driving current industry performance in the Third-Party Real Estate Activities in Italy industry?
Outlook
Analysis
What's driving the Third-Party Real Estate Activities in Italy industry outlook?
Volatility
Analysis
What influences volatility in the Third-Party Real Estate Activities in Italy industry?
Charts
- Industry Volatility vs. Revenue Growth Matrix
Life Cycle
Analysis
What determines the industry life cycle stage in the Third-Party Real Estate Activities in Italy industry?
Charts
- Industry Life Cycle Matrix
Products and Markets
Highlights
Trends
- Largest Market
- Product Innovation
Key Takeaways
Demand for administrative services wanes in an economic slowdown. When economic conditions are uncertain, businesses typically rein in investment, hitting demand for administrative expenses.
Products and Services
Charts
- Products and Services Segmentation
Analysis
How are the Third-Party Real Estate Activities in Italy industry's products and services performing?
Analysis
What are innovations in the Third-Party Real Estate Activities in Italy industry's products and services?
Major Markets
Charts
- Major Market Segmentation
Analysis
What influences demand in the Third-Party Real Estate Activities in Italy industry?
International Trade
Highlights
- Total Imports into Italy
- Total Exports into Italy
Heat maps
- Industry Concentration of Imports by Country
- Industry Concentration of Exports by Country
Data Tables
Value and annual change (%) included
- Number of Imports and Exports by European Country (2024)
Competitive Forces
Highlights
Trends
- Concentration
- Competition
- Barriers to Entry
- Substitutes
- Buyer Power
- Supplier Power
Key Takeaways
Hybrid real estate agencies further fragment the industry. The growing presence of online-only and hybrid estate agencies ramped up the fragmented nature of the industry.
Supply Chain
Charts
Buyer and supply industries
Geographic Breakdown
Business Locations
Heat maps
- Share of Total Industry Establishments by Region (2024)
Data Tables
- Number of Establishments by Region (2024)
Charts
- Share of Establishments vs. Population of Each Region
Analysis
What regions are businesses in the Third-Party Real Estate Activities in Italy located?
Companies
Data Tables
Top 10 companies by market share:
- Market share (2024)
- Revenue (2024)
- Profit (2024)
- Profit margin (2024)
External Environment
Highlights
Trends
- Regulation & Policy
- Assistance
Key Takeaways
Regulation is fierce in the industry. Regulation aims to ensure fair and transparent real estate transactions, protect the interests of consumers and maintain the integrity of the real estate market.
External Drivers
Analysis
What demographic and macroeconomic factors impact the Third-Party Real Estate Activities in Italy industry?
Financial Benchmarks
Highlights
Trends
- Profit Margin
- Average Wage
- Largest Cost
Key Takeaways
Muted business investment hits demand for third-party real estate services. Rising interest rates in the two years through 2023 ratcheted up borrowing costs, resulting in businesses reining in investment.
Cost Structure
Charts
- Share of Economy vs. Investment Matrix
-
Industry Cost Structure Benchmarks:
- Marketing
- Depreciation
- Profit
- Purchases
- Wages
- Rent
- Utilities
- Other
Analysis
What trends impact cost in the Third-Party Real Estate Activities in Italy industry?
Key Ratios
Data tables
- IVA/Revenue (2014-2029)
- Imports/Demand (2014-2029)
- Exports/Revenue (2014-2029)
- Revenue per Employee (2014-2029)
- Wages/Revenue (2014-2029)
- Employees per Establishment (2014-2029)
- Average Wage (2014-2029)
Country Benchmarks
European Leaders & Laggards
Data Tables
Top and boottom five countries listed for each:
- Revenue Growth (2024)
- Business Growth (2024)
- Job Growth (2024)
European Country Performance
Data Tables
Rankings available for 37 countries. Statistics ranked include:
- IVA/Revenue (2024)
- Imports/Demand (2024)
- Exports/Revenue (2024)
- Revenue per Employee (2024)
- Wages/Revenue (2024)
- Employees per Establishment (2024)
- Average Wage (2024)
Structural Comparison
Data Tables
Trends in 37 countries benchmarked against trends in Europe
- Concentration
- Competition
- Barriers to Entry
- Buyer Power
- Supplier Power
- Volatility
- Capital Intensity
- Innovation
- Life Cycle
Key Statistics
Industry Data
Data Tables
Including values and annual change:
- Revenue (2014-2029)
- IVA (2014-2029)
- Establishments (2014-2029)
- Enterprises (2014-2029)
- Employment (2014-2029)
- Exports (2014-2029)
- Imports (2014-2029)
- Wages (2014-2029)
Methodology
Where does IBISWorld source its data?
IBISWorld is a world-leading provider of business information, with reports on 5,000+ industries in Australia, New Zealand, North America, Europe and China. Our expert industry analysts start with official, verified and publicly available sources of data to build an accurate picture of each industry.
Each industry report incorporates data and research from government databases, industry-specific sources, industry contacts, and IBISWorld's proprietary database of statistics and analysis to provide balanced, independent and accurate insights.
IBISWorld prides itself on being a trusted, independent source of data, with over 50 years of experience building and maintaining rich datasets and forecasting tools.
To learn more about specific data sources used by IBISWorld's analysts globally, including how industry data forecasts are produced, visit our Help Center.
 France
 Italy
Italy
 Spain
Spain