
Australia’s data centre pipeline is growing faster than the public conversation can keep up. Today we’re launching Understanding Australia’s data centre build-out, a map and dataset that track the data centre rollout, its capacity and the electricity data centres are forecast to use. Here’s why we built it.
In July, as we were updating the Cloud Storage Services in Australia report, something felt off. The report is always challenging to research, with difficulties tracking data centres, collecting and segmenting company financials and understanding the rapidly changing trends in the industry. That challenge isn’t unique to us. It’s notoriously hard to keep up, even for the Australian Energy Market Operator (AEMO), which has access to significantly more confidential and detailed data than we can glean publicly. However, on this update the discussion was particularly removed from the data.
Media and analysis coverage routinely painted a picture of the build-out that didn’t match what a hand count of data centre projects, their megawatt (MW) capacity or capital expenditure figures showed. The entire conversation was dominated by the 2025 AEMO forecasts, despite the capital expenditure pipeline, work done and the number of new project announcements surging since that release. Building approvals in the category that includes data centres more than doubled to $17.7 billion in 2025-26. The value of projects under construction in that category also rose from $10.0 billion to $27.2 billion and the value of work done nearly doubled to $6.7 billion. It should have been clear that the AEMO forecast was well out of date, but the conversation was slow to catch up. And the general public was left careening towards a rude awakening in August 2026, when AEMO released its revised forecast.
Within just 12 months, AEMO’s Step Change scenario forecast for data centre electricity use in 2033-34 had been revised up by almost half, from 19.9 terawatt hours (TWh) to 29.2 TWh. That’s about 12% of all electricity demand on the east coast grid, according to our estimates, up from 2.8% in 2025-26.
By 2030-31, AEMO expects data centres to use roughly as much electricity as every household in Sydney, Melbourne and Brisbane combined.
In late August, days after the new AEMO forecast, we released an article on just how difficult it is to keep track of developments in the industry, the challenges of forecasting and why it’s essential that voters can transparently weigh up the costs and benefits of this rapidly evolving industry. Without clarity to make informed decisions, Australian voters may feel, like many do in the United States, that they have been blindsided by the industry and their government.
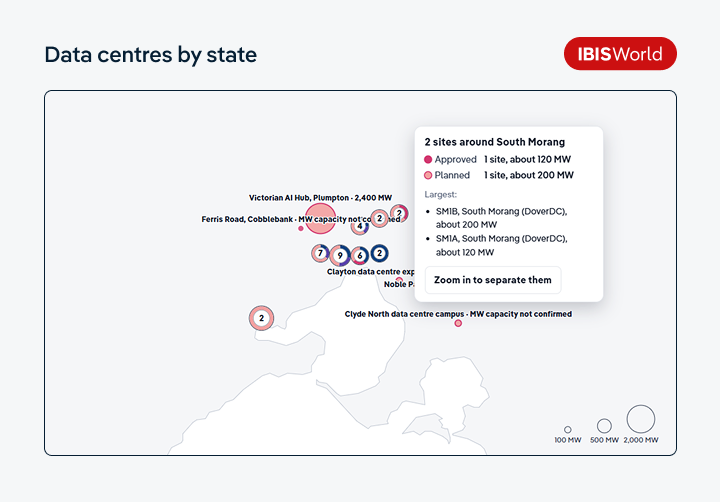 The map and accompanying data we’re releasing today are a small step towards filling that information gap. We hope to give people a clearer view of the data centre pipeline, its capacity and what it could mean for electricity use.
We’ll also track the data between AEMO updates, so readers can see how that forecast might be developing and what kind of upward or downward revision we might expect. The pipeline moves in both directions: about 36% of the projects on AEMO’s 2025 list have since been cancelled. But since AEMO’s 1 July data cut-off, 10 data centre projects with a combined capacity of about 6,900 MW have become public, and building approvals in the relevant category reached $3.5 billion in July and August alone. Not all of these will be new to AEMO’s forecast, but they show how fast the pipeline is moving. We’ll continue updating the map as new data emerges, to keep pace with the industry.
This data is not easy to collect from public sources. Gaps remain and estimates are required at times. We’ll keep it as accurate as public information allows. If you’d like more data or details on any of these measures, how they’re calculated and what assumptions underpin them, please reach out.