IBISWorld Platform
Answer any industry question in minutes with our entire database at your fingertips.

The total value of world trade is estimated to reach $35.7 trillion in 2026, up 9.7% from the previous year. This high growth is driven by the ongoing geopolitical tensions, such as the US-Israeli actions on Iran. As a result, the Strait of Hormuz, which accounts for about one-fourth of global oil shipments, has effectively been closed, albeit temporarily. This has driven up oil prices as the market has been pricing in expectations of a future shortage. Rising energy costs have inflated global trade as importers pay more for essential energy supplies. Over the five years to 2026, the value of world trade has experienced significant volatility. In 2021, world trade saw a sharp 25.6% rebound, increasing to $28.1 trillion as economies reopened and demand surged following pandemic-induced contractions. This upswing was amplified by pent-up demand and improvements in global vaccination rates, though supply-side bottlenecks, particularly in semiconductor chips and electrical components, constrained production throughout the supply chain. These issues were compounded by the resurgent coronavirus variants in late 2021 and early 2022, which stalled some economic reopening and delayed broader global recovery.The onset of the Russia-Ukraine war in March 2022 generated fresh headwinds. Sanctions on Russia and disruptions in global wheat, barley and sunflower supplies inflated commodity prices and exacerbated existing supply chain challenges. Despite these obstacles, trade rose 12.5% in 2022, underpinned by resilient consumer spending and business activity. Nonetheless, growth decelerated in 2023 amid persistent global tensions and an unsettled macroeconomic environment, driving trade values down by 1.8%. The value of world trade rebounded by 4.3% in 2024. In 2025, values grew by 0.5%, as economic rebounds were threatened by global trade uncertainty and rising geopolitical tensions. As tensions rise between Russia, China and Western nations, trade has been affected significantly. Meanwhile, in 2025, the Trump administration introduced tariffs that have led to significant uncertainty. However, trade deals between the US and regions such as Japan and the European Union have helped to sustain trade.Significant macroeconomic trends during the current period include strong trade growth by developing economies, particularly in East Asia and Africa. South-South trade has also seen strong growth over the past five years, and this is expected to continue, reinforcing regional trade dynamics. Rapid expansion in automation and AI has supported strong trade growth in high-value goods such as semiconductors, batteries and AI hardware. However, higher public and private debt, particularly in developing economies, has continued to weaken import demand.
Curious about what drives these trends? IBISWorld's analyst coverage on the total value of world trade includes detailled analysis on the current performance, outlook and industries affected.
1980-2032
This report analyzes the total value of all goods and services traded over international borders in a given year. Figures are in nominal terms and sourced from the United Nations Conference on Trade and Development.
IBISWorld Industry Reports are available in multiple formats to fit seamlessly into your workflow.

Answer any industry question in minutes with our entire database at your fingertips.
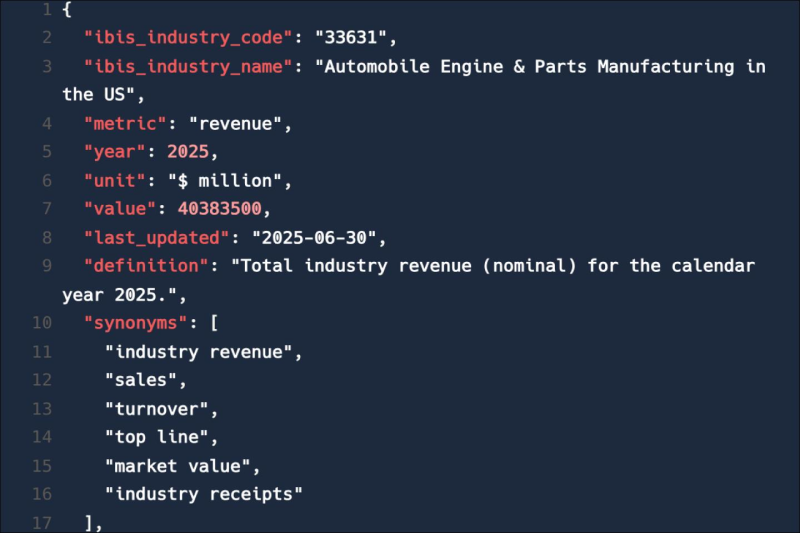
Feed trusted, human-driven industry intelligence straight into your platform.
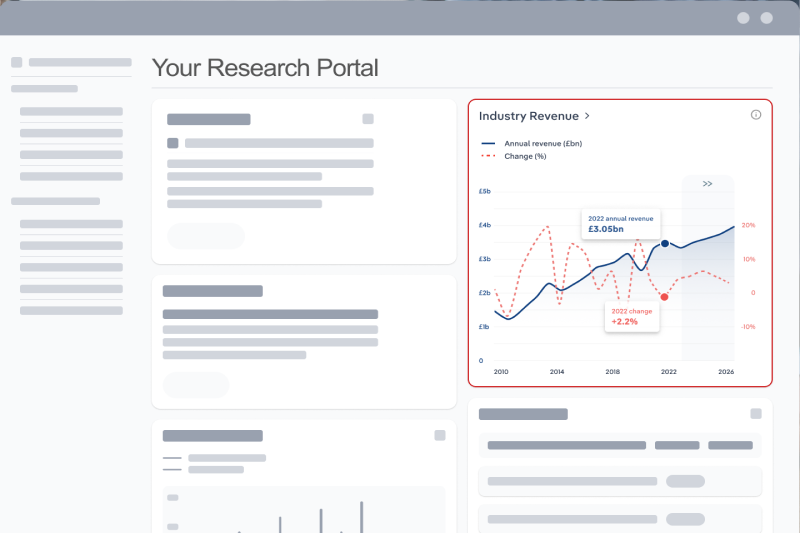
Streamline your workflow with IBISWorld’s intelligence built into your toolkit.
Explore industries with similar markets, supply chains, and economic drivers to gain broader context and insights.
| Industry | Country | Last 5-yr CAGR | Forecast 5-year CAGR | Revenue |
|---|---|---|---|---|
| Water Freight Transport in Australia |

|
XX% | XX% | $XX |
When the stakes are high, you need intelligence that cuts through the noise—wherever you work.
The total value of world trade in Australia in 2026 was 35.69 trillion dollars.
The total value of world trade in Australia grew by 4.92% in 2026.
IBISWorld’s data and analysis on total value of world trade in Australia includes forecasted growth rates over the next five years.