
IBISWorld Platform
Answer any industry question in minutes with our entire database at your fingertips.

IBISWorld forecasts the motor vehicle price index to decline by 1.3% in 2026-27 to 99.7 points. This decline is expected to be driven by a forecast appreciation of the Australian Dollar. The RBA implemented a series of three consecutive 25-basis-point cash rate hikes in the late stage of 2025-26, as the central bank looked to quell inflation driven by the conflict in the Middle East. With potential further rate rises tipped over the early stages of 2026-27, demand for Australian currency is likely to expand, as investors chase a return on Australian cash investments. Currency appreciations support a decline in the motor vehicle price index as all cars sold in Australia are imported from offshore manufacturers. Therefore, local retailers are able to procure stock at a lower cost, supporting price-based competition among car dealerships.Over the three years through 2022-23, motor vehicle prices witnessed the heaviest period of growth since the mid-1990s. Prices were initially inflated by pandemic-related supply chain constraints, particularly for crucial components like semiconductors. This caused the price of second-hand vehicles to skyrocket, as consumers flocked to purchase used cars that weren't subject to the supply delays that riddled the new car market. High discretionary income during the period also pushed up demand for luxury vehicles, boosting the average sales price for motor vehicles. As global supply chains rebuilt capacity, supply shortages eased, which limited price growth in 2023-24. However, high inflation continued to push up prices for goods across Australia, with motor vehicles being no exception. The index fell significantly in the September 2024 quarter and remained relatively steady throughout the remainder of 2024-25, as an increase in the supply of used vehicles helped relieve some market-driven price inflation. In 2025-26, the motor vehicle price index increased by 1.0%. However, this trailed the headline CPI inflation of 3.9% over the same period. This deviation was largely driven by excess inflation in service-based industries influencing CPI and market-share-stealing tactics via competitive prices by Chinese importers aiming to carve out a larger position in the Australian market.While the motor vehicle price index has increased over the past five years, it remains well down on all-time high levels of 117.4 points, reached in 1995-96. Prior to the expansion witnessed over the past five years, vehicle prices in Australia had declined in the long run, as the Federal Government opened up the domestic automotive manufacturing sector to foreign competition. Tariffs on imported vehicles fell from 45% in 1995 to 25% the following year. The tariff has since been on a long-term decline, eventually falling to its current level of 5.0% in 2010. Additionally, the exits of Ford in 2016 and Toyota and GM Holden from the Australian Motor Vehicle Manufacturing industry in 2017 ensured that the lion's share of domestic demand for passenger motor vehicles has been satisfied by imported cars. Since these imported vehicles are generally sold at lower prices, this has created a downward trend in average motor vehicle prices over the long term. In recent years, the increase in supply of Chinese-manufactured car imports into the Australian market has contained price growth. Across the 2025 calendar year, Chinese imports jumped by 31% and accounted for 20% of all new car sales. This trend continued into the early stages of 2026, with over 35% of new cars sold in May 2026 being manufactured in China. The import penetration of BYD, GWM and MG has driven this trend, with all three ranking among the top 10 passenger vehicle sellers in Australia in the 2025 calendar year. Overall, IBISWorld expects the motor vehicle price index to increase at a compound annual rate of 1.1% over the five years through 2026-27.
Curious about what drives these trends? IBISWorld's analyst coverage on the motor vehicle price index includes detailled analysis on the current performance, outlook and industries affected.
1973-2034
This report analyses the price of motor vehicles in Australia. The price index measures the purchase cost of motor vehicles for households and includes household purchases of new vehicles and purchases of second-hand vehicles from businesses or government sectors. The index used is an input for the consumer price index. This report uses data sourced from the Australian Bureau of Statistics and is measured in points, with a base of 100 points in the 2024-25 financial year.
IBISWorld Industry Reports are available in multiple formats to fit seamlessly into your workflow.

Answer any industry question in minutes with our entire database at your fingertips.
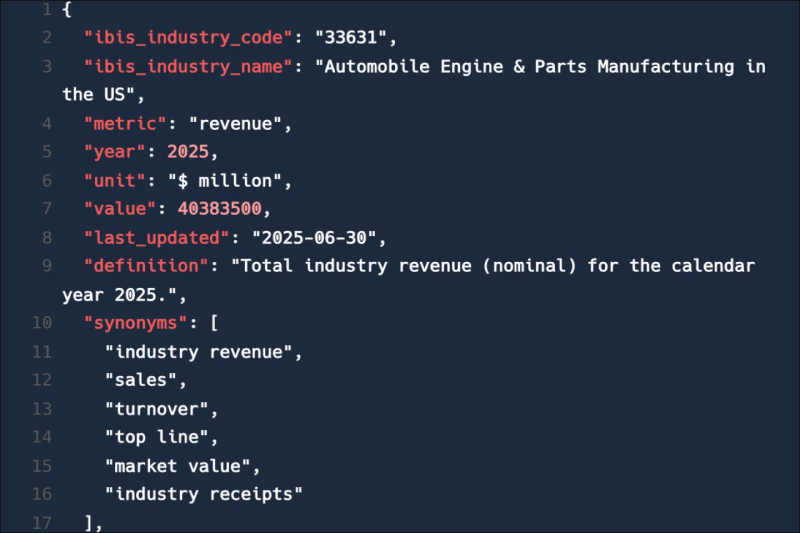
Feed trusted, human-driven industry intelligence straight into your platform.
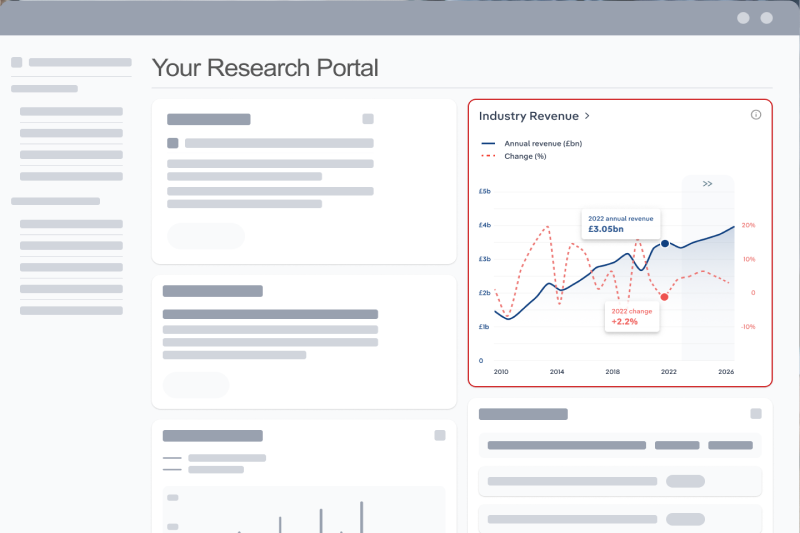
Streamline your workflow with IBISWorld’s intelligence built into your toolkit.
Explore industries with similar markets, supply chains, and economic drivers to gain broader context and insights.
| Industry | Country | Last 5-yr CAGR | Forecast 5-year CAGR | Revenue |
|---|---|---|---|---|
| Motor Vehicle Electrical Services in Australia |

|
XX% | XX% | $XX |
| Automotive Industry in Australia |
|
XX% | XX% | $XX |
| Motor Vehicle Wholesaling in Australia |
|
XX% | XX% | $XX |
| Motor Vehicle Dismantling & Used Parts Wholesaling in Australia |
|
XX% | XX% | $XX |
| Motor Vehicle Retailing in Australia |
|
XX% | XX% | $XX |
| Transport Equipment & Large Vehicle Rental in Australia |
|
XX% | XX% | $XX |
| Transport Equipment & Large Vehicle Rental in Australia |
|
XX% | XX% | $XX |
| Passenger Car Rental and Hiring in Australia |
|
XX% | XX% | $XX |
| Passenger Car Rental and Hiring in Australia |
|
XX% | XX% | $XX |
When the stakes are high, you need intelligence that cuts through the noise—wherever you work.
The motor vehicle price index in Australia in 2027 was 99.7 index points.
The motor vehicle price index in Australia grew by 1.06% in 2027.
IBISWorld’s data and analysis on motor vehicle price index in Australia includes forecasted growth rates over the next five years.