About the Organic Chemical Pipeline Transportation in Arizona Market Research Report
What’s Included in the Organic Chemical Pipeline Transportation in Arizona Market Research Report
Definition of the Organic Chemical Pipeline Transportation in Arizona?
Pipeline operators provide pipeline transportation services for chemical products like carbon dioxide and ammonia. Pipeline operators that transport crude oil, refined petroleum products, natural gas and natural gas liquids are excluded from this industry.
What’s included in the Organic Chemical Pipeline Transportation in Arizona?
The Organic Chemical Pipeline Transportation in Arizona includes pipeline transportation of carbon dioxide, pipeline transportation of anhydrous ammonia, pipeline transportation of hydrogen, pipeline transportation of industrial gases, pipeline transportation of chemicals and pipeline transportation for other products. Related terms covered in the Organic Chemical Pipeline Transportation in Arizona industry report includes a colorless, pungent gas extensively used to manufacture fertilizers and a wide variety of nitrogen-containing organic and inorganic chemicals, a chemical bond between one carbon atom and two oxygen atoms. it is used to bond to oil in wells where there is hard-to-get oil, midstream operations include the processing, storing, transporting and marketing of petroleum products and technological process that captures industrial carbon emissions and stores it underground.
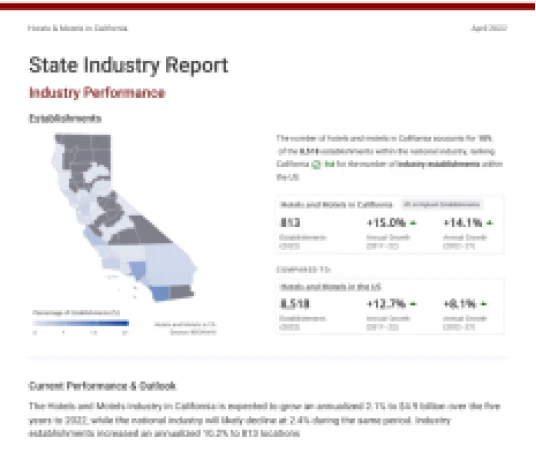
Industry Performance of the Organic Chemical Pipeline Transportation industry in Arizona
Benchmark the Organic Chemical Pipeline Transportation in Arizona industry performance with all AZ county and national performance.
Organic Chemical Pipeline Transportation in Arizona
#28 in Highest Revenue 1% of state's GDPRevenue (2026)
Annual Growth (2021-26)
Annual Growth (2026-31)
Organic Chemical Pipeline Transportation in the US
Revenue (2025)
Annual Growth (2020-25)
Annual Growth (2025-30)
For the full list of industry drivers, see report purchase options.
Key Drivers of the Organic Chemical Pipeline Transportation industry in Arizona
See how key industry drivers, such as population, unemployment rate, per capita disposable income, industrial production index, oil and natural gas price index and access to credit are impacting Organic Chemical Pipeline Transportation in Arizona
Arizona Economic Indicators
Population
Unemployment Rate
Per Capita Disposable Income
View more economic information in AZ State Economic profile
US Key External Drivers
Industrial production index
Oil and natural gas price index
Access to credit
For the full list of industry drivers, see report purchase options.
County Data of the Organic Chemical Pipeline Transportation industry in Arizona
Access proprietary data on county in the Organic Chemical Pipeline Transportation in Arizona, such as Yavapai County, Navajo County and Coconino County. Data includes figures on revenue, establishments, employees and wages by counties.
Key Statistics of the Organic Chemical Pipeline Transportation industry in Arizona
Download 19 years of historical data and 5 years of projected performance.