
IBISWorld Platform
Answer any industry question in minutes with our entire database at your fingertips.

IBISWorld forecasts per capita gambling expenditure to fall by 1.0% in 2026-27 to total $466.36. The phased implementation of the Online Casino Gambling Act 2026 is likely to constrain expenditure growth. The Act came into force on 1 May 2026, while online casinos operating before that date may continue to provide services until 1 December 2026; only approved operators will subsequently be permitted to serve New Zealand customers while their licensing applications are assessed. This transition introduces stronger consumer-protection and harm-minimisation requirements, which are set to to moderate gambling activity in 2026-27.Per capita gambling expenditure has been highly volatile over the past five years. Gambling in New Zealand falls into four main categories: NZ Racing Board (TAB), lotteries, gaming machines and casinos. Per capita expenditure on TABs and casinos has declined over the period, while expenditure on gaming machines and lotteries has remained relatively stable, with casinos expanding. COVID-19 pandemic lockdowns particularly affected venues reliant on foot traffic, like casinos and TABs. Casinos and other licensed gambling venues were required to temporarily close during lockdowns in 2021-22, mainly reducing casino and gaming machine gambling expenditure. Gambling expenditure subsequently increased sharply in 2022-23 as restrictions eased. Lottery expenditure can vary significantly, with large jackpots often encouraging greater participation, while casino expenditure also fluctuates annually. Initiatives to reduce the number of non-casino gaming machines have constrained expenditure over time. Conversely, growing use of online wagering products has supported gambling expenditure, although only the NZ TAB app is included in this driver, limiting the extent to which offshore online gambling activity is captured.Government initiatives introduced to reduce problem gambling have decreased per capita gambling expenditure over the past five years. For instance, the number of non-casino poker and gaming machines has been in decline since 2004, as the Gambling Act has placed restrictive pressure on establishing new machines. Regional governments have the authority to approve or deny new gaming machine licences, with community pressure to reduce the number of non-casino machines driving the decline. The Ministry of Health's (Manatu Hauora) gambling-harm strategy and levy apply from July 2025 through to June 2028, funding harm-prevention, intervention and treatment services. These initiatives have dampened gambling adoption rates and per capita gambling expenditure over the period. Overall, IBISWorld estimates per capita gambling expenditure to rise at a compound annual rate of 0.2% over the five years through 2026-27.
Curious about what drives these trends? IBISWorld's analyst coverage on the per capita gambling expenditure includes detailled analysis on the current performance, outlook and industries affected.
2004-2034
This report analyses per capita gambling expenditure in New Zealand. The definition of gambling constitutes all legalised forms, including gambling at casinos, gaming, lotteries, horseracing and sports betting. Expenditure is taken as a net figure, in other words, expenditure is the amount lost or spent by players, as well as the gross profit of the gambling operator. Expenditure is measured per person over the year ending June. The data for the report is sourced from the Department of Internal Affairs (Te Tari Taiwhenua).
IBISWorld Industry Reports are available in multiple formats to fit seamlessly into your workflow.
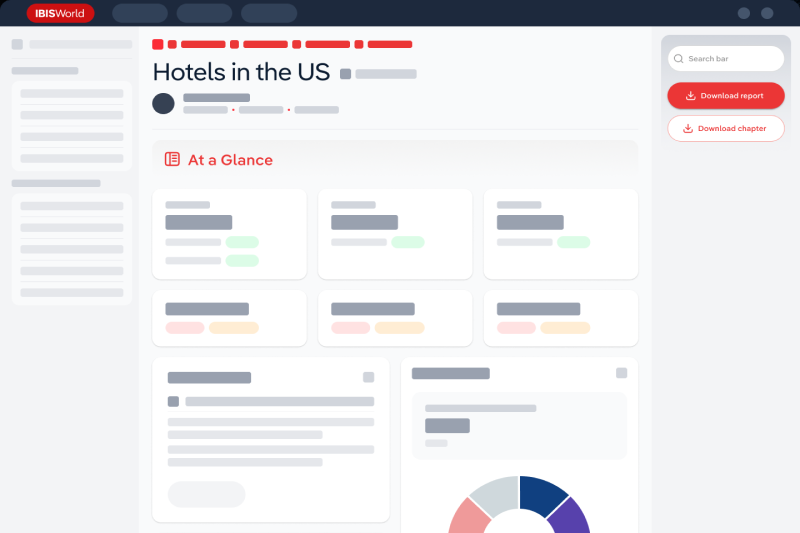
Answer any industry question in minutes with our entire database at your fingertips.
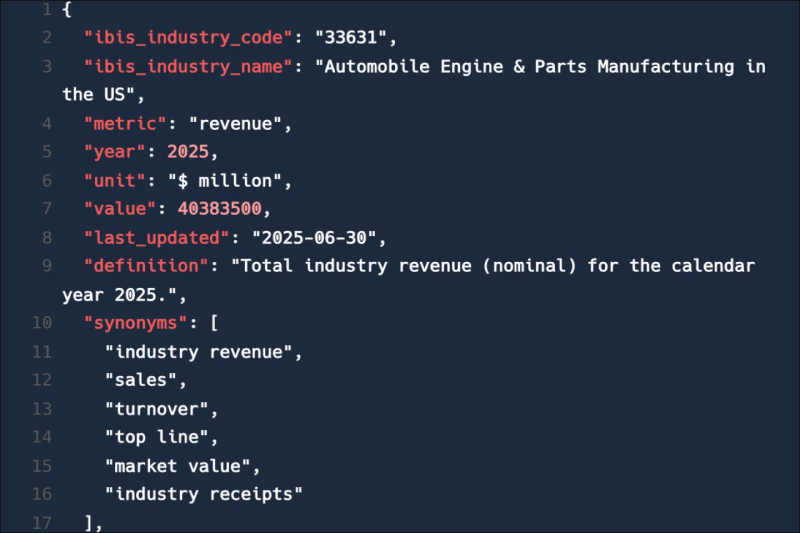
Feed trusted, human-driven industry intelligence straight into your platform.
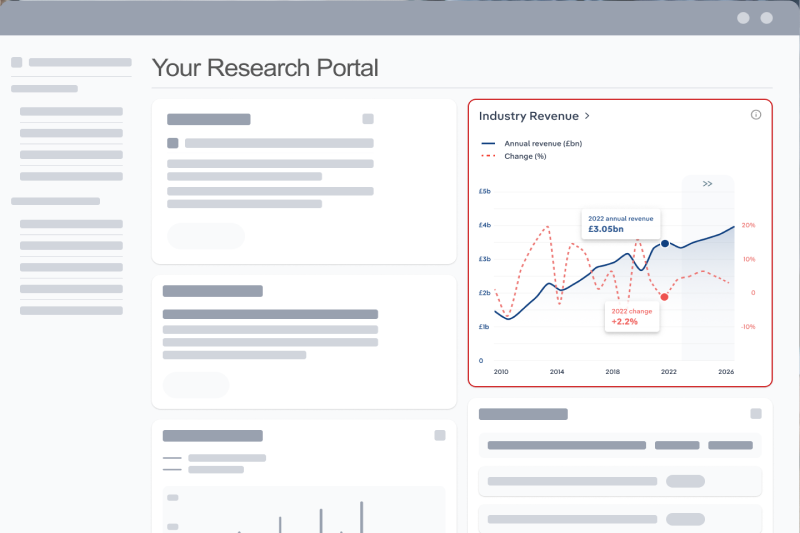
Streamline your workflow with IBISWorld’s intelligence built into your toolkit.
Explore industries with similar markets, supply chains, and economic drivers to gain broader context and insights.
| Industry | Country | Last 5-yr CAGR | Forecast 5-year CAGR | Revenue |
|---|---|---|---|---|
| Lotteries & Bookmaking Operations in New Zealand |

|
XX% | XX% | $XX |
When the stakes are high, you need intelligence that cuts through the noise—wherever you work.
The per capita gambling expenditure in New Zealand in 2027 was 466.36 $.
The per capita gambling expenditure in New Zealand grew by 0.17% in 2027.
IBISWorld’s data and analysis on per capita gambling expenditure in New Zealand includes forecasted growth rates over the next five years.