IBISWorld Platform
Answer any industry question in minutes with our entire database at your fingertips.

IBISWorld forecasts that the number of stock market trades will retreat by 9.9% in 2026-27 to 613.8 million. A more hawkish monetary environment, which is squeezing households and leaving less discretionary income for investment vehicles like stocks, has driven this rare retreat in trading volume.Historically, stock market trades have exhibited relatively consistent double-digit growth since 1992. Before the pandemic, the number of yearly stock trades declined on only three occasions and failed to achieve double-digit growth in a further five years. Since the pandemic, the number of stock trades exhibited its two largest declines since 1992 in 2020-21 and 2022-23. In 2020-21, global economic uncertainty led many investors to hold fire, with a slowdown following a surge in sell-off activity late in 2019-20. Booming commodity prices and economic and policy responses to the pandemic saw the value of the All-Ordinaries index climb to a then record high in January 2022, benefiting confidence in the value of equities and supporting the number of stock market trades in the following months. However, nine cash rate increases in 2022-23 amid soaring inflation and a return to normal spending patterns among consumers post-lockdowns contributed to another steep drop-in stock market activity. In the years that followed, falling inflation and cuts to the cash rate saw the number of stock trades rebound over the two years through 2024-25.Central banks around the world have begun raising interest rates in response to stubborn inflation, owing in no small part to the energy crises that have arisen following the US-Israel conflict with Iran, which began in late February 2026. Both higher prices and an elevated cash rate, the latter a result of the Reserve Bank of Australia (RBA) returning to a tightening cycle, have conspired to reduce household discretionary income, in turn limiting the funds available for stock trades. Rapid appreciation in asset values over the past 12 months, particularly in companies associated with AI data centre build-out and semiconductor production, influenced the 54.1% rally in stock market trades for June 2026 compared to the year prior. However, unlike the normal pattern of the number of trades in the months of the new financial year outpacing that of the previous June, the 2026-27 year shows a different pattern, with monthly trades instead retreating. This diversion from normality may point towards an immediate impact of higher rates and a weakening perceived wealth effect that could be flowing from falling housing prices.The ASX has capitalised on new technologies by implementing new trading platforms, thereby reducing transaction costs and increasing capacity. Over the past five years, increased accessibility and reduced transaction fees offered by electronic trading brokerage firms have also significantly driven volume growth. This trend has been offset by the ASX's underperformance relative to global indices, making it less attractive to investors. However, the presence of ASX-listed global ETFs has provided local investors with domestic access to foreign asset classes, reducing the ASX's dependence on Australian-listed companies' performance to remain an attractive exchange to trade on. Overall, IBISWorld forecasts the number of stock market trades to strengthen at a compound annual rate of 6.5% over the five years through the end of 2026-27.
Curious about what drives these trends? IBISWorld's analyst coverage on the number of stock market trades includes detailled analysis on the current performance, outlook and industries affected.
1992-2034
This report analyses the trend in the number of trades on the Australian stock market (measured in millions). This number includes volumes for equity trades, interest rate and hybrid securities, listed exchange-traded options, warrants, structured products and futures contracts. The data for this report is sourced from the Australian Securities Exchange (ASX) and the Australian Securities and Investments Commission and is presented in financial year terms.
IBISWorld Industry Reports are available in multiple formats to fit seamlessly into your workflow.
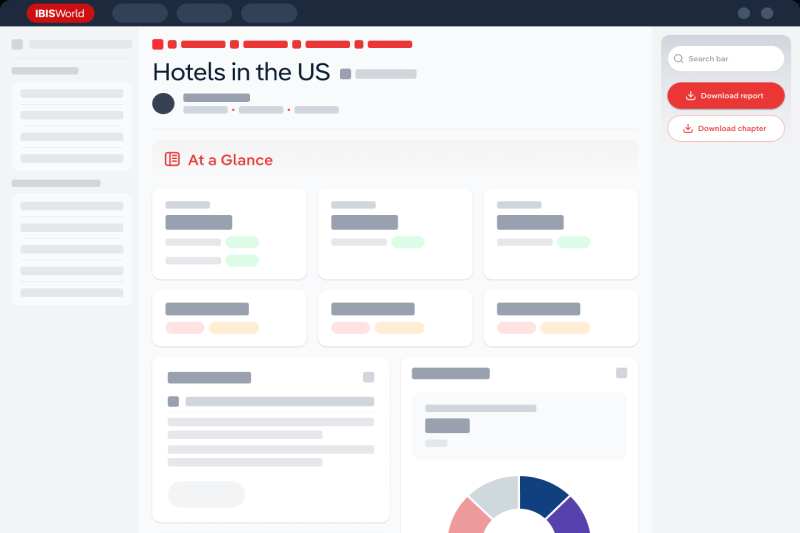
Answer any industry question in minutes with our entire database at your fingertips.
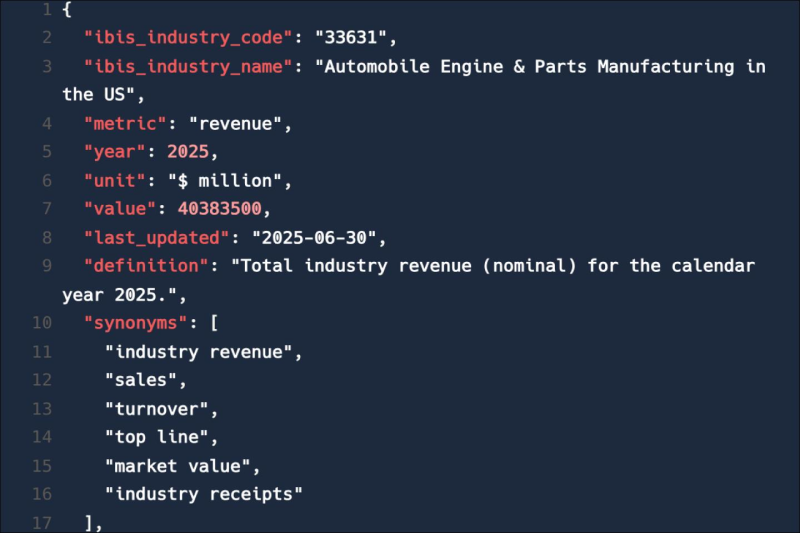
Feed trusted, human-driven industry intelligence straight into your platform.
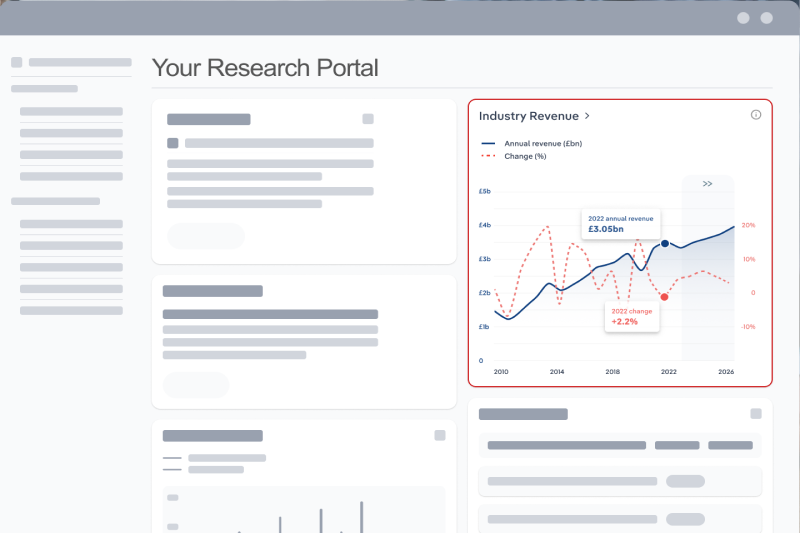
Streamline your workflow with IBISWorld’s intelligence built into your toolkit.
Explore industries with similar markets, supply chains, and economic drivers to gain broader context and insights.
| Industry | Country | Last 5-yr CAGR | Forecast 5-year CAGR | Revenue |
|---|---|---|---|---|
| Custody, Trustee & Stock Exchange Services in Australia |

|
XX% | XX% | $XX |
| Investment Banking & Securities Brokerage in Australia |
|
XX% | XX% | $XX |
When the stakes are high, you need intelligence that cuts through the noise—wherever you work.
The number of stock market trades in Australia in 2027 was 613.8 million.
The number of stock market trades in Australia grew by 6.49% in 2027.
IBISWorld’s data and analysis on number of stock market trades in Australia includes forecasted growth rates over the next five years.