October 1, 2025
Written by Dr. Richard Buczynski, Kent Kirby, Robert Miles, Dev Strischek
Living in a noisy world…
“If everything is important, then nothing is.”
Patrick M. Lencioni, author and management consultant
In an insightful LinkedIn post, “Why uncertainty is worse than bad news”, Dr. Enric Bernal writes, “Unknown bad news is the worst (situation) as they can cause rumination and anxiety…”
Made more than five years ago during the onset of the pandemic, this observation seems even more apropos today. The capricious vacillating nature of policy announcements exacerbated by fissures between and within both the Republican and Democratic Parties (note the recent federal shutdown) has unnerved business strategists and risk managers. The maddening daily shifts in tariffs, and other policy pronouncements, along with uncertainties involving precisely how policies will be carried out, have challenged decision-makers’ ability to establish priorities for their business and pursue actionable responses.
Indeed, “If everything is important, then nothing is.”
At times like these, skilled analysts, awash with data and drowning in waves of post-Great Recession models, are stymied, as their informational advantage over senior managers wanes. It’s much more than information overload; we are all being buried under near real time “information” that is both highly volatile, discordant, and just plain noisy. When, for example, have Supreme Court rulings carried so much weight in determining market and economic performance?
And if this isn’t enough, we often become confused by the vagaries of official data updates which are often preliminary estimates subject to revisions that are more pronounced during times of uncertainty and economic shocks. There are also growing concerns that government agency data is becoming less reliable; a trend that could accelerate owing to DOGE’s agency budget cutting.
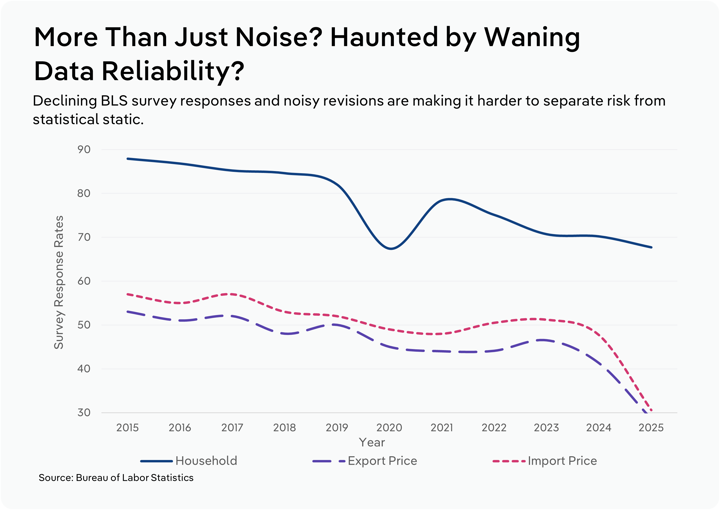
Here’s something you may not have known: Bureau of Labor Statistics survey response rates have been declining rapidly, further compromising reliability. This not only includes the Household Labor survey, but the Establishment survey that includes increasingly vital export and import prices. Unlike Census reports, these surveys aren’t mandatory, and businesses have way too much going on to provide timely and sufficient responses. Technically, the BLS uses donor cell and regional/hierarchical interpolation to fill in data gaps which may mute variations in price data.
For bankers responsible for credit portfolio management, charting a prudent course through unprecedented noise can significantly impede the ability to effectively manage risk. Indeed, there are both financial and opportunity costs associated with being overly reactionary and hurriedly shifting exposures within a portfolio. As we illustrate below, it’s all a matter of identifying and prioritizing the key risks that are important to your organization.
The path forward needn’t be serpentine…
One can merely muddle through or proactively develop a systematic infrastructure building upon your bank’s own existing risk management capabilities. As such, a major theme of this project is to propose a stepwise algorithm designed to cut through the seemingly endless stream of “information” that needs to be filtered, prioritized and processed into both actionable plans and flexible contingencies. In fact, this process was summarized at IBISWorld’s virtual banking client roundtable this past March.
Our hope is to assist commercial banking policymakers seeking safe and sound lending by centering on risk management (identifying, quantifying, monitoring, and mitigating risk) while discovering solid lending opportunities at a time of considerable uncertainty. Several IBISWorld risk management tools will be employed in this endeavor.
Much like the tools IBISWorld developed during the pandemic and our special study on supply chain risks, the situation begs for a commonsense procedure identifying mounting risks associated with specific lines of business, consistent with the fundamentals of Enterprise Risk Management. We advocate a mixed approach to ERM that leans more heavily on judgment and experience while still leveraging models and/or existing risk management frameworks as tools for refining grading systems, running sensitivity tests (scenarios), and building obligor scorecards.
At the center of the process are IBISWorld’s NAICS mapping tables. These concordances, or crosswalks, are embedded in many of our portfolio management databases and tools, and they include all the 700 NAICS-based industries covered by IBISWorld.
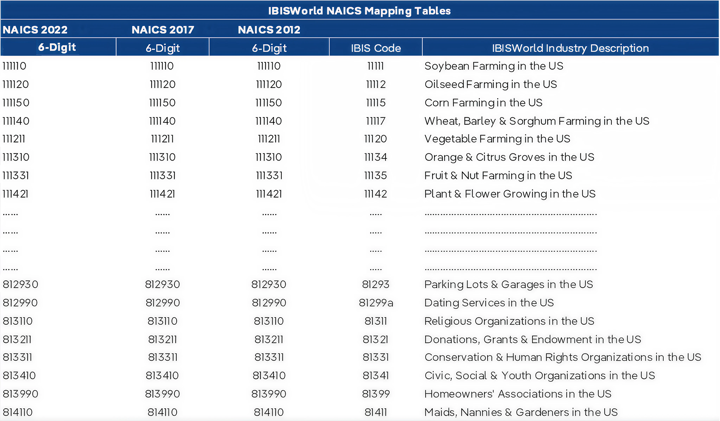
As we’ll see later, these mappings, serving as the epicenter of a relational database, will prove invaluable for integrating IBISWorld’s Key Risk Indicators (KRIs), with a bank’s Key Performance Indictors (KPIs). The result empowers the user to establish clear priorities based on underlying loan exposures.
Where we’re headed today…
Although the audience for this effort are primarily commercial bank policymakers and risk managers, other organizations with a keen interest in Enterprise Risk Management or an inherent curiosity about how the process of identifying, quantifying, monitoring and managing risk plays out, should find this piece worthwhile. Insurance carriers, “non-traditional” financial institutions, organizations involved in valuations, consulting practices, and equipment leasing and financing companies are among those who should find value in our work.
There are two distinct themes:
- First, we focus on two major sources of risk: (i) tariffs and trade policy and (ii) America’s debt burden. Our analysis is largely data driven, with the objective of introducing key factors that are germane to understanding the sequence of interrelated forces that determine credit risk. We argue that many of the elements highlighted below are often undervalued or misinterpreted.
- Second, we build on this analysis and employ a top-down approach using an example of a hypothetical bank struggling to cope with these risks. Establishing prudent, actionable lending priorities and empowering bankers to carry them out defines our endgame. The story unfolds as bank policymakers wend their way through the clutter by employing a stepwise methodology employing an easily implemented sequence of well-documented tools.
Blending these themes into the narrative, our analysis is organized as follows.
Starting with tariffs and trade policies:

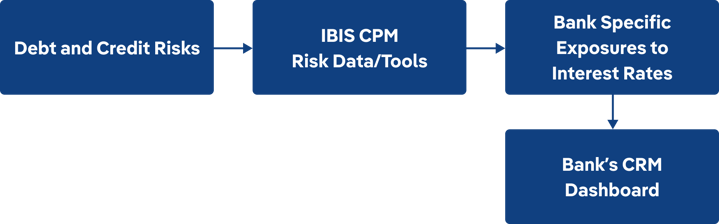
As for debt and interest rate risk we have added CRM (customer relationship management) dashboards, thus enabling policymakers and risk managers to communicate effectively with the field:
ALERT: Many of our clients have been using this framework for decades, and many more, both large and small banks, are adopting this procedure at their own pace, step-by-step.
In summary, clients should consider this an informational document outlining how to better leverage your IBISWorld service agreement.
Part I: Major Sources of Credit Risk
On-again, off-again tariffs…muddling, befuddling…
As of this writing, shifts in trade policy, and related legal challenges, continue to dominate the news. The risk that inflation, fueled by higher American tariff rates and retaliation by our major trading partners, has been beaten to death in the 24/7 news cycle. Moreover, concerns over mounting uncertainty have manifested volatile, eroding consumer and business sentiment. Even optimists reckon that the dust probably won’t settle until much later this year, at best, as tedious trade negotiations with multiple countries crabwalk forward.
Even if an optimistic view on tariffs prevails, which we don’t share, there are several wild cards that need to be considered.
The well-known lagged impacts of tariffs on inflation and other economic indicators, including the value of the US dollar. Currently, lags may also be attributed to delays in administering and collecting tariffs.
America doesn’t have a monopoly on populism or protectionist tendencies. Our view is that protectionism in the global trading system is now more sensitive to a slowdown in economic activity than in previous years. With the International Monetary Fund and the Organization for Economic Cooperation and Development both calling for a slowdown in global GDP next year with markedly greater downside risks, the chance of new tariff barriers in key American overseas markets will linger regardless of any perceived progress in trade talks.
The U.S.-Mexico-Canada Trade Agreement (USMCA) is up for review in 2026. Add to this the uncertainty of America’s midterm elections next year!
China has put a six-month limit on rare-earth export licenses for U.S. automakers and manufacturers giving Beijing leverage if trade tensions erupt. As IBISWorld warned in our 2021 special study on bottlenecks cited above, “China accounts for 80% of rare earths imports to America, an economic a potential national security threat. Rare earth elements are used in components in high technology devices, including smart phones, digital cameras, computer hard disks, LED lights, flat screen televisions, computer monitors, and electronic displays. Moreover, some are used in clean energy and defense technologies.”
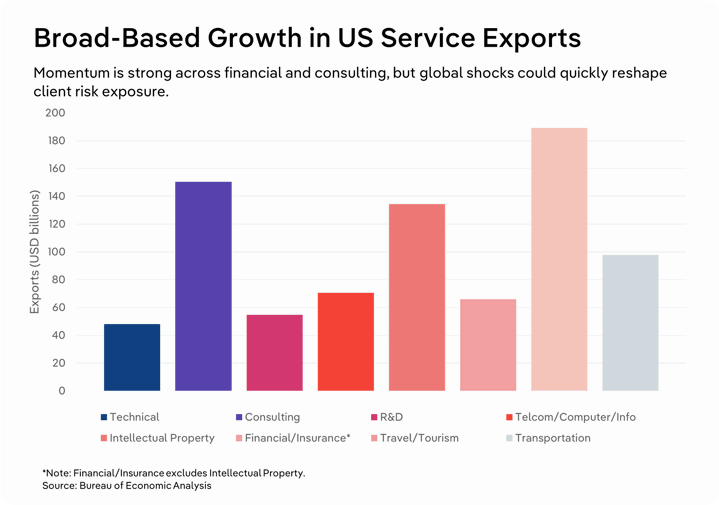
And there’s more that may not be on your radar screen. In a 2019 article, Buczynski and Strischek observed, “Trade in services, which has consistently enjoyed surpluses for decades has registered broad-based success…” This underscores the importance of America’s earnings from service trade. Travel and tourism and intellectual property, which include income from franchises, trademarks and licensing fees, are massive earners for US companies. According to the US Travel Association, just a 10% decline in tourists from Canada to the US is estimated to cost $2.1bn and a loss of 14,000 American jobs.
The risk is that trade disputes may bleed into service trade.
ALERT: Keep in mind that even should the harsh rhetoric fade, other trade-related issues may take centerstage.
How to identify, measure, monitor and mitigate tariff risks: IBISWorld’s US Trade Tariff Tool…
Earlier this year, IBISWorld developed a US Trade Tariff Exposure Tool. The tool, now freely available for all US industry clients, enables the user to quickly identify tariff-related risks by providing up-to-date data at an industry level. Using a proprietary mapping of NAICS codes to the Harmonized Tariff Schedule (HTS), the tool allows the user to determine which imported products are most relevant to specific lines of business in a bank’s portfolio—and whether they’re currently subject to tariffs or proposed measures.
Here's a simple illustration on how a client might employ the tool to assess their exposure to America’s three largest trading partners given key industries in a hypothetical bank’s manufacturing line-of-business (LOB). An expert user familiar with HS codes can drill deeper to download actual tariff rates that are updated monthly.
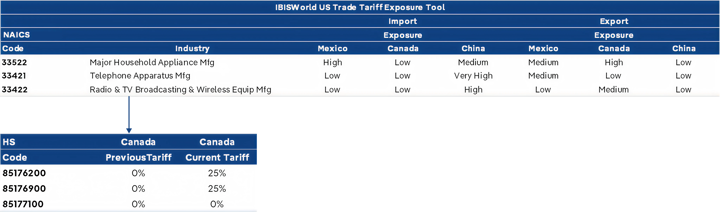
Documentation and a short video of the tool are available here.
For those interested in a deeper dive into what bankers and lenders need to do to monitor and mitigate tariff risk in their Loan portfolios check out this article by Dev Strischek.
Shifting the burden of tariffs: the importance of pricing power…
Pricing Power is an important concept that needs to be incorporated in any meaningful assessment of the impacts of tariffs or, for that matter, any analysis of cost-push inflation regardless of its source. It refers to the ability of a business to raise prices and pass on a significant share of the increased cost burden to customers without suffering significant losses in market demand or an erosion of profits. Typically, companies with pricing power enjoy stable, relatively high profit margins. They are more likely to survive or even prosper during periods of inflation and economic downturns; scenarios that are currently becoming increasingly likely.
To supplement our work on the US Trade Tariff Exposure Tool, IBISWorld has recently created a pricing power metric. Consistent with IBISWorld’s Industry Risk Ratings, the new metric is called Pricing Power Risk and will soon be available for all of the core NAICS-based industries published in IBIS’s Industry Early Warning System (EWS). So, like our risk scores, the higher the score the lower the pricing power of an industry, hence the higher its pricing power risk.
After considerable experimentation and statistical testing, we have settled on four parameters to calculate the Pricing Power Risk score. The first three come directly from the Structural Risk Score that constitutes a component of IBISWorld’s Total Risk Score.
- Degree of Competition
- Industry Imports
- Barriers to Entry Score
- Availability of Substitute Goods/Services
These are factors that always come into play when assessing the credit worthiness of an individual obligor or the inherent risk of a LOB. They are consistent with Porter’s Five Forces.
This new metric should be viewed as a forewarning of potential problems even if the impacts of a disturbance, like higher tariffs, have yet to materialize. It will be made available in our EWS and accessible for clients that utilize API by November 2025. Technical documentation will be made available at that time.
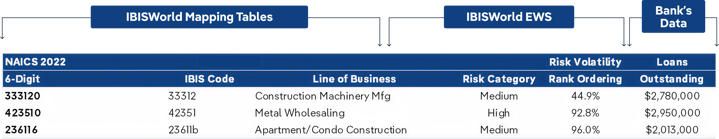
Consider a simple example of how a hypothetical IBISWorld banking client might incorporate key metrics from our EWS (including the new Pricing Power Risk category) while integrating our data with their own key indicators and availing themselves of the mapping tables in the EWS.
It might look something like the following:
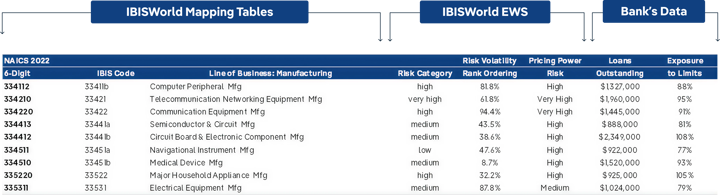
ALERT: The degree of an industry’s pricing power is critical to a meaningful assessment of the impacts of tariffs or, for that matter, any analysis of cost-push inflation regardless of its source. It will soon be available to users of IBISWorld’s Early Warning System.
America’s budget deficits and debt: up, up and away!
Along with tariffs and trade policies, another key issue raised at IBISWorld’s March 2025 banking client roundtable was the growing burden of American debt and the associated interest rate risks. Amid tension-packed budget negotiations that persisted into early summer, uncertainty on both the course of fiscal and Federal Reserve policies ramped up. In mid-May Moody's Ratings downgraded the United States' credit rating from AAA to Aa1, citing the nation's mounting debt. One needs to be reminded that S&P downgraded the US government in 2011, while Fitch followed suit 2023. This story is not new, it just has fresh, stronger, legs.
With the “Big Beautiful Bill” signed by President Trump on July 4th, it’s clear that there’s ongoing bipartisan support for--you guessed it--lingering budget deficits and seemingly endless growth in America’s national debt!
In the sequence of charts that follow, we’ll rely on the data available in the Congressional Budget Office’s (CBO) reports.
Let’s start with the CBO’s projections of our fiscal deficit. If you have paid close attention, it’s clear their outlook hasn’t fundamentally changed significantly in years, even across multiple administrations.
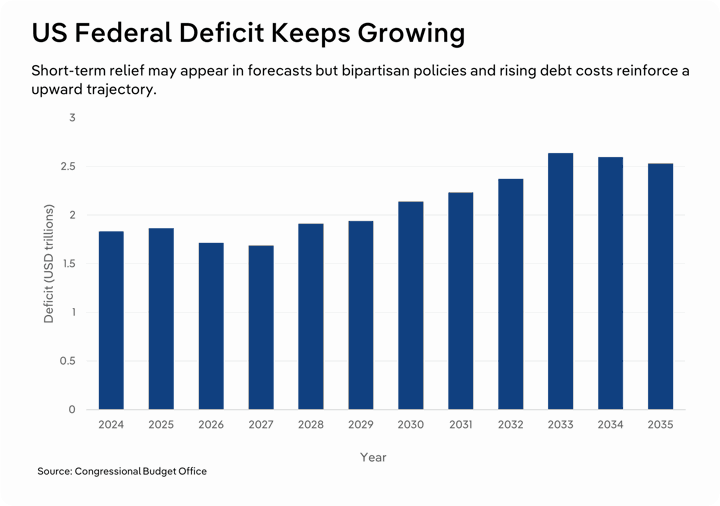
In fact, we haven’t run a surplus since the Clinton years! Circa 2001!
Are we beyond a tipping point?
Discretionary spending has been the primary political battle… But…the reality is quite different.
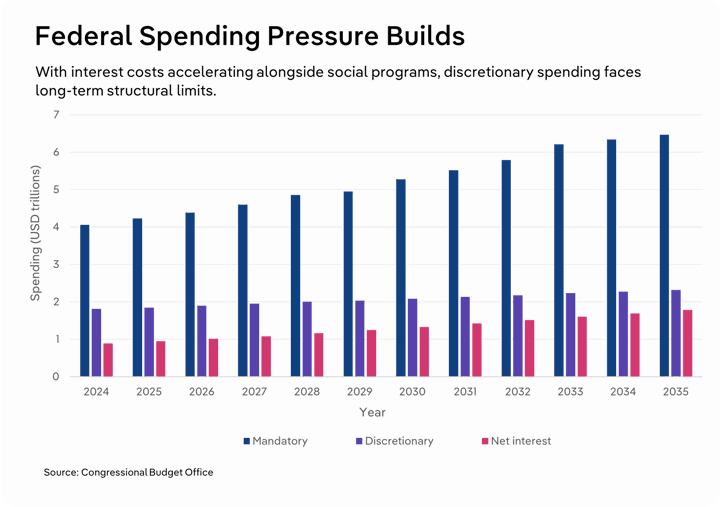
ALERT: Currently, interest payments required to service our national debt account for more than half of total discretionary spending. This proportion will continue to climb…and climb… Mandatory expenditures, which include social security, Medicare and Medicaid, are projected to persist as the lion's share of deficit spending.
No wonder markets and credit agencies are alarmed!
Chronic fiscal deficits perpetuate the massive accumulation of Federal debt.
Note that underlying the CBO’s ten-year deficit and debt projections are assumptions that the Personal Consumption Expenditures Price (PCE) inflation (the Fed’s preferred inflation indicator) averages around 2.0% annually while real GDP rises 1.8% per year. This is a far cry from a downside “stagflation” outcome in which the rise in our national debt would be even more acute than depicted in this chart.
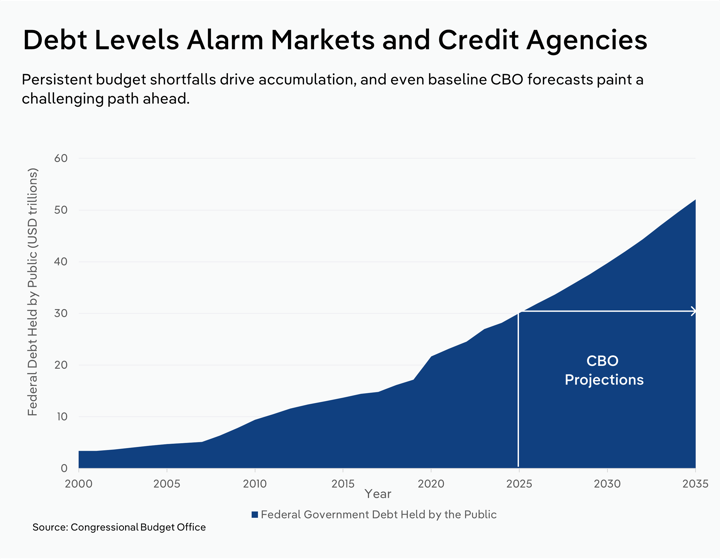
And this doesn’t include intragovernmental debt—money the government owes itself!
More on that next…
Don’t shut the adding machine off just yet!
That’s not all folks! America’s federal debt is only part of the saga.
ALERT: This is where we depart from the usual storyline… There are many more pieces to put into the financial puzzle.
Although many are often fixated on the growth of our federal government's debt, there are other obligors that need to be included in the financial equation. Charting Federal Reserve data as seen below provides a more comprehensive picture of the demand side of American credit markets.
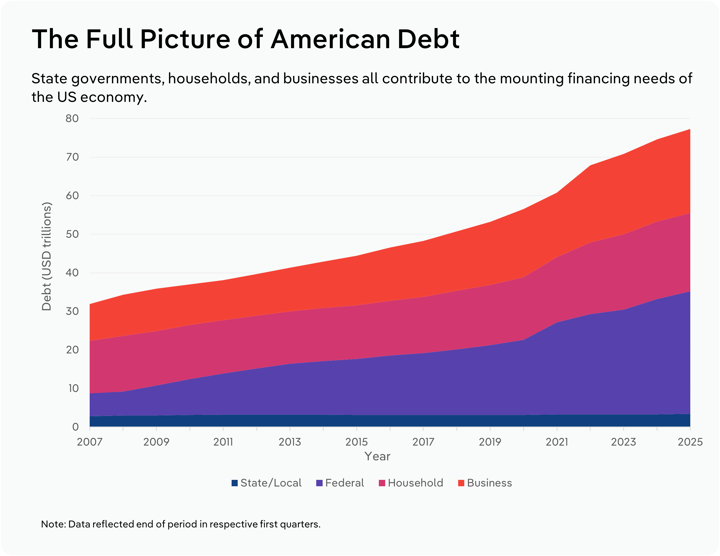
Punch these figures into your adding machine…
There’s been a surge in both household and corporate debt over the past five-plus years. In March of this year household debt hit $20.3 trillion, and corporate debt reached $21.8 trillion. (In the context of tariff risks, the concurrent explosion in corporate and household is worrisome, with corporate and consumer spending exposed to the burden of increased costs. After all, someone must pay the levies on imports. If it breaks consumers’ financial backs, then we have demand destruction as private consumption is accounts for around 70% of American GDP.)
Add that to more than $3 trillion in state and local government borrowings, plus roughly $4 trillion intergovernmental debt, and we are currently sitting on more than $77 trillion in combined American liabilities!
So what?
Well, these segments are all competing for funds!
Incidentally, for those interested in a comprehensive global view of these borrowing segments and overall financial conditions and risks, we strongly suggest you consult the Bank for International Settlements June 2025 Annual Report.
Key takeaway: The federal government competes with state and local governments, households and corporations for funding. Together, these borrowers need to be included when examining American finance.
And there’s the thorny issue of credit quality…
The sheer magnitude of debt is exacerbated by growing evidence that credit quality is eroding. According to the Federal Reserve Bank of New York’s May 2025 Household Debt and Credit Report, all categories of consumer debt are becoming riskier.
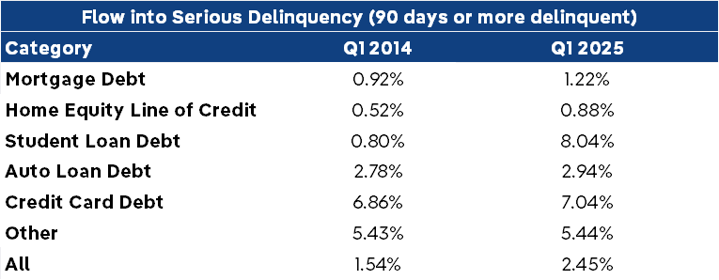
Source: Federal Reserve Bank of New York
There’s an additional caveat regarding student loans—many deferrals have either ended, and since interest accrual was not turned off, the actual debt outstanding is now much higher. Moreover, student debt isn’t the exclusive domain of the young as reported in a recent Wall Street Journal article. A ticking time bomb?
Mounting concerns are also emerging for subprime auto lending. Banks with exposures in auto manufacturing, auto parts and dealerships have more than just tariffs to worry about. Indirect auto lending is another segment that requires diligent monitoring and scrutiny.
Commercial and Industrial (C&I) loans “seem” okay, but a deeper drive into your exposures is warranted…
Business loan delinquencies have been creeping up the past two years, but so far at lower rates than those during the Great Recession. Nonetheless, many businesses, large and small, are now facing uncertain prospects of rising operational costs, the higher cost of credit, and labor shortages.
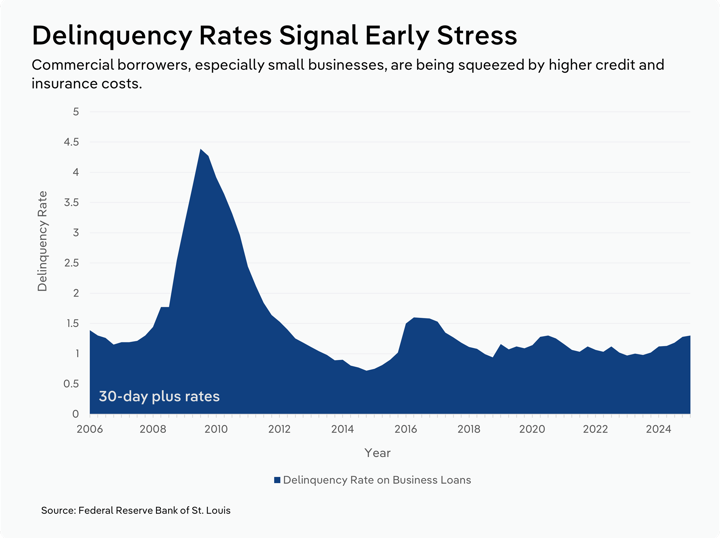
Banks should diligently examine their smaller commercial customers, particularly those carrying significant inventories requiring short-term financing or facing substantial hikes in insurance rates, which represent a new and growing challenge for many businesses.
Just six years ago, Buczynski and Strischek profiled the aggregate US debt status and observed, “Interest-sensitive industries and those exposed to the crowding-out effect require considerable scrutiny, especially by bank credit committees... Think about construction (CRE and related C&I), CAPEX, and even small retail mom-and-pop shops that are dependent on short-term credit to finance operations or inventories of product.”
ALERT: A new risk factor has surfaced in the form of surging insurance costs. Rising premiums have been an issue for some time, but legal fees associated with mounting personal injury cases constitute a new threat. In some states with recurring weather-related disasters, insurance carriers have either hiked premiums to unprecedented heights or simply canceled policies.
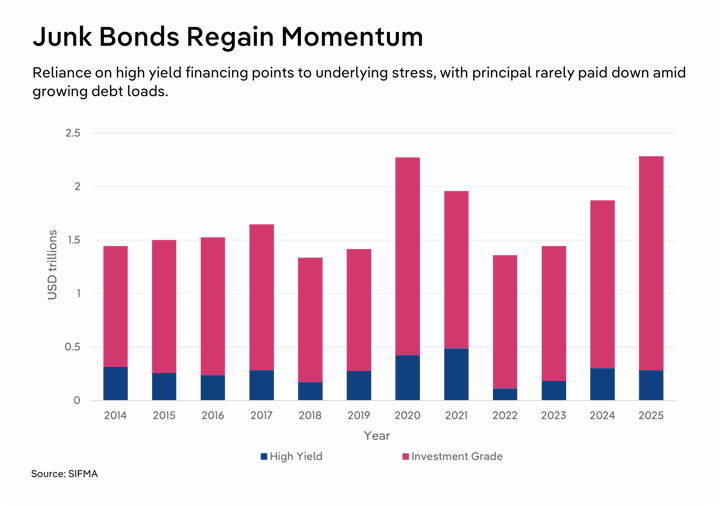
Is there junk hidden in the basement?
As delinquencies on business loans creep upward, the issuance of “high yield” corporate, or so-called junk bonds, appears on the ascent as well, also signaling a potential erosion in credit quality. Keep in mind that junk bond issuers often don’t pay down principal, and as issuers roll over the debt, it can continue growing.
Becoming too comfortable with all the junk? 2007 revisited?
What may be even more disconcerting is the thinning noninvestment grade bond spreads relative to very low risk treasuries.
We have been tracking the ICE BofA US High Yield Index for years as a proxy for the degree of corporate bond market risk-taking. Essentially, this is a risk premium paid for holding junk bonds, where the lower the percentage, the greater the apparent risk appetite for noninvestment grade corporate bonds. In the chart below we see that risk spreads on noninvestment grade bonds have dipped to levels not observed since just before the Great Recession.
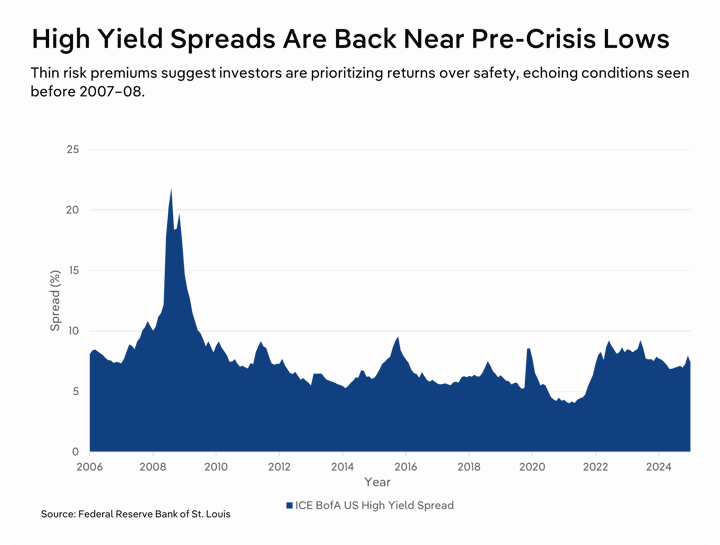
Our intention in presenting this data is not to unnerve the reader but rather to suggest monitoring some easy-to-track, unique, high frequency indicators that, as was the case during the financial crisis, may foretell an ominous outcome.
There is also a smattering of anecdotal evidence that risk-taking is becoming more pervasive. Furtive exposures to volatile cryptocurrencies by corporations and financial institutions, along with traded funds a la ETFs, are worrisome along with the proliferation of light-regulated fintechs.
Consider, for example, an excerpt from a July 10, 2025, Wall Street Journal article by Matt Wirz:
“Some bonds tied to GoodLeap, a financial-technology firm that lends money for solar installations, have stopped paying interest, people familiar with the matter said. The payments stopped because far more homeowners are defaulting on the loans than initially forecast, they said… Several GoodLeap competitors filed for bankruptcy court protection in June, and some bonds backed solar loans trade at deep discounts.”
The surge in private credit defaults is another matter requiring attention, if you can excuse the pun. You may want to check out this recent piece in the Wall Street Journal.
Key Takeaway: Remember that the high yield market does not account for the growth in Private Credit, which is yield sensitive as well. People aren’t necessarily going to the capital markets but rather placing debt directly, thereby introducing another source of risk that is latent and difficult to quantify.
Frothy markets on your mind?
Concurrent with frothy equity markets, we’re seeing a surge in margin debt as brokerage firms have extended a record high $1 trillion in margin credit to customers through the end of June. During the past three months the ramping up of investor leverage to purchase equities is similar to what transpired in mid-2007, and we all know what happened then! Then there’s Black Friday back in October 1929—time to celebrate the Centennial?
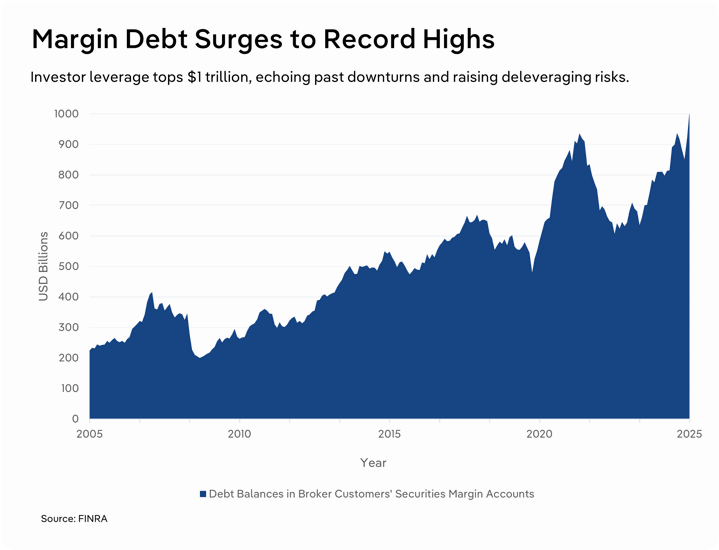
Stock buybacks, predominantly by very large banks and behemoth tech companies, have temporarily bolstered their balance sheets during a period of surging equity prices, but we’ve seen all this before!
We wonder… More fuel for the risk fire?
Key takeaway: Both junk bond premiums and margin debt are becoming reminiscent of pre–Great Recession levels! We suggest you track this prescient data.
There’s another critical piece to the credit puzzle…
America is one of many players in the global financial market!
So, any analysis of debt and overall credit markets without understanding the interplay of world financial markets is seriously incomplete and therefore flawed. We choose to embrace a more holistic view.
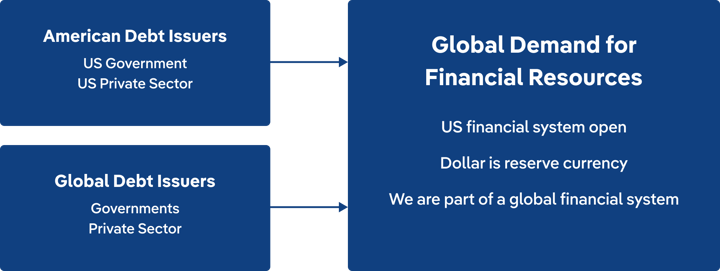
The USA is not alone when it comes to mushrooming government debt. According to the International Monetary Fund, worldwide public debt already exceeds $100 trillion. The Institute of International Finance reports that when we include the private sector, global debt hit a new record high exceeding $324 trillion in Q1 2025.
The upshot? Directly or indirectly, the US government, American companies and consumers are competing for limited financial resources around the world.
Indeed, it’s all Economics 101—supply and demand. The interaction of borrowers and creditors on a global scale determines the “price of money” (interest rates), the availability of credit and, lest we forget, credit quality. It’s much more than just Fed policies.
Yes, the Fed’s recent cut in the target federal funds rate is a factor, but it is merely a small piece of the global financial puzzle. As such, the interplay of global financial forces percolates down to the very micro level—even to the smallest loan in a bank’s portfolio…
Key takeaway: Foreign governments, households and businesses also compete for limited funds! Any examination of America’s financial situation that neglects this reality is sadly deficient.
US Treasuries: Looking across the seas for creditors…
Foreigners purchase and hold a significant share of America’s Federal “publicly held” debt.
Keep this in mind: even while foreign holdings of U.S. debt continue to increase, their share of the total is on the decline!
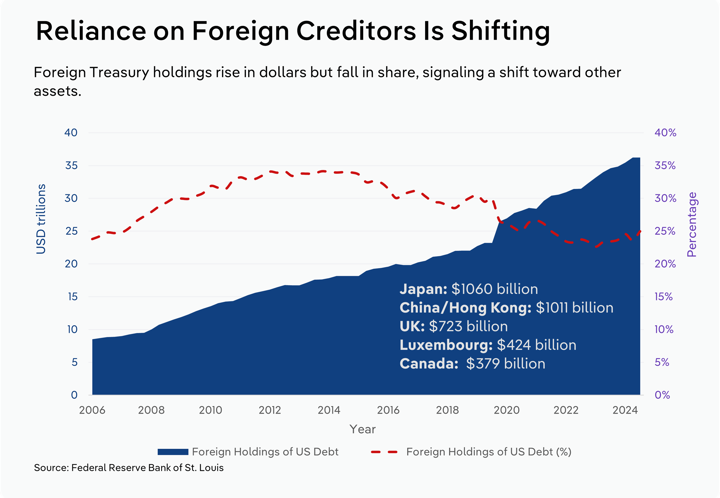
Other currencies have grown in importance as a medium of exchange (payments) internationally. Moreover, non-US domiciled assets have grown in popularity as, over time, financial markets open, equity markets in developing economies mature, and global financial markets become increasingly integrated. Even China started allowing for overseas trading in yuan some twenty years ago.
Although the international prominence of the US dollar remains undeniable, and is still viewed as a haven and a “reserve currency”, we’re not the only game in town.
A quick digression: Undeniably, there’s much more to globalization than trade in goods and cross-border investments in physical capital; one must also consider nonstop, massive financial transactions. According to a Bank for International Settlements survey, forex transactions alone have been estimated at over $9.6 trillion per day in April 2025! To put this into perspective, in 2024, America’s goods and services trade deficit was $918 billion.
Real-time reactions to data releases, social media rants by public officials (or “influencers”) echo through global markets at the speed of light. No wonder we face bouts of volatility amid incessant cacophony!
Key takeaway: The supply of funds from international sources may not keep up with American demand, putting upward pressure on interest rates.
Preponderance of short-term debt adds to the financial challenge…
There’s more stress on the financing side of the US debt story. As referenced in an April 19, 2025 article in The Economist, the federal government must repay $9 trillion in debt over the next year, and a large portion are treasury bills that mature in a year or less.
Increasingly, treasury auctions are relying on bills rather than longer term bonds/notes. We speculate that this can be attributed in large part by growing uncertainty regarding Fed policy and the overall economic outlook. [Incidentally, there was a spike in short-term issuance because of emergency funding under Covid-19 Economic Relief programs; which was quickly reversed.]
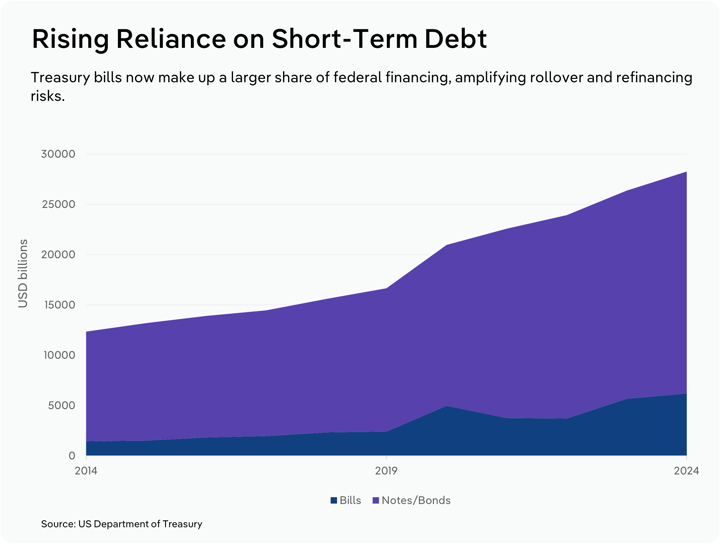
This overreliance has resulted in a peculiar-shaped yield curve; in late September secondary market rates on 1-month treasuries were roughly 70 basis points higher than 2-year bond yields.
Key takeaway: It’s useful to track the trend in the composition of federal debt, as the recent rise in the share of Treasury Bills strains overall financial requirements.
The Fed’s self-made quandary? It’s more than walking a thin line on the Phillips curve…
Although tariffs haven’t substantially impacted producer or consumer prices as of this writing, the Fed continues to embrace a cautious “wait and see” stance. The passage of the GOP’s mega bill muddies the water further as the legislation is likely viewed as potentially inflationary by the Fed’s Board of Governors.
At the Fed’s annual Jackson Hole Economic Policy Symposium, Fed Chair Jerome Powell suggested that the neutral setting for interest rate, the level that neither stimulates nor slows economic activity, might be higher than it was last decade. He also indicated that the Fed will be more diligent in adhering to a 2% inflation target even if previous rates were well below the mark. The core personal consumption expenditures price index was up 2.9% in August at 2.9%, far above the current Fed target.
Juxtaposed are the Fed’s concerns over economic growth and a fragile labor market. A myriad of forces are at play, notably massive white-collar layoffs (Microsoft, Proctor and Gamble, Google and Intel to name a few), federal government downsizing, immigration policies, AI’s stunning proliferation and a pervasive hesitancy on the part of employers to hire new workers.
Indeed, the Fed’s view of the Philipps curve is shrouded by fog. The labyrinth of monetary policy choices involving delicate tradeoffs between inflation and employment are becoming considerably more arduous.
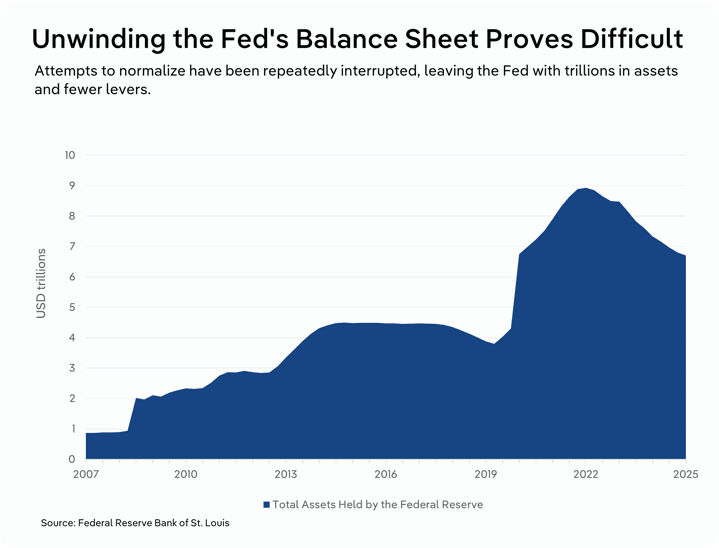
We have all read about these challenges. But the Fed’s policy quandary extends beyond interest rates. What we haven’t heard much about lately is the Federal Reserve’s balance sheet.
Recall the unprecedented multiple phases of Quantitative Easing (QE) that took place from December 2008 to October 2014, during which the Fed amassed over $4 trillion in US treasuries and mortgage-backed securities. [See: Rick Buczynski, “The Fed’s Quantitative Easing and C&I Lending Opportunities,” The RMA Journal, May 2013.]
Prior to the QEs, the Fed held only around $930 billion in assets primarily used to conduct Open Market Operations, including “emergency” interventions to thwart near-term liquidity crises. [Few may recall September 2019 when the Fed intervened in the repo market injecting tens of billions of dollars averting a mysterious spike in short-term interest rates. Unless you were a day trader, you probably didn’t even notice!]
In the years following the QEs, the Fed moved to “normalize” its balance sheet, a process interrupted by the pandemic. So now what, within the context of growing funding needs of the federal government? This puts an entirely new spin on the Fed’s mantra of being the “lender of last resort”.
Muse over these two questions:
- Did you know that without fanfare the Federal Reserve recently made a surprising move by purchasing $20 billion in 3-year Treasury bonds in a single day?
- Did you know that the CBO projects the Fed’s holdings of Treasurys will climb to $9.9 trillion in 2035—more than double today’s amount?
Key takeaway: Perhaps the Fed’s orthodoxy is threatened as a result of nontraditional roles the Fed itself orchestrated, potentially gutting its ability to conduct prudent monetary policy. A “buyer of last resort” burdened with purchasing excess treasuries is a far cry from its “lender of last resort” mission. This adds another dose of uncertainty to the financial equation.
Further, as we wrote in early 2020,“Extremely low interest rates for nearly two decades have expanded the risk appetite of the entire American economy, not just in the banking sector, and have spawned a collective insatiable hunger for more cheap debt.” We argue that the economy has restructured itself amid decades of extremely low interest rates. This addiction has, and will continue to, haunt us as a latent risk that is often unrecognized.
Finally, if this doesn’t scare you, consider a scenario where the Fed loses its independence to the White House, or just as bad, Congress… Is there a black swan treading water in the Potomac River?
Part II: Achieving Closure with a Stepwise Illustration of How Many Commercial Banking Clients Apply “Best Practices”
We’ll walk through a sequential, top-down example on how a hypothetical bank might investigate its portfolio’s sensitivity to the cost of credit (interest rates), dovetailing this process with our analysis of debt above.
Let’s start with…
Concentration risk tools: IBISWorld's key macro drivers and supply chain databases
In an article on concentration risk, Buczynski and Kirby discussed best practices in identifying, mapping, measuring, and monitoring concentration risk along the ERM chain. As they stated, “By incorporating these mappings into early warning systems, banks can design a practical system for stress testing, scenario analysis, and commercial scorecard development—all with the aim of more effective risk management and profitable business development.”
Two popular databases are utilized by our banking clientele in this process: (1) The Key Macro Drivers and (2) Supply Chain databases. Like our EWS, data is delivered as a workbook with NAICS mapping tables.
Our Macro Drivers workbook enables clients to identify which industries are most vulnerable to a specific shock…
IBISWorld’s Macro Drivers, or common factors database, includes drivers in four major categories similar in scope to the data found in Fed’s Stress Test Scenarios. Below are some examples of the type of variables we maintain.
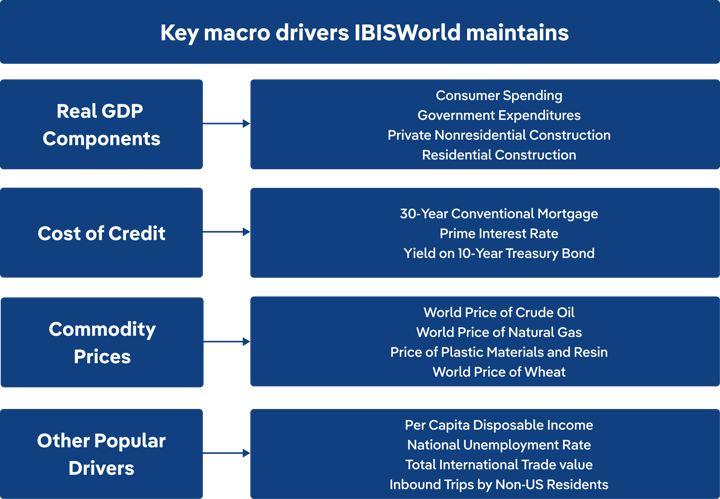
- It is well known that each specific industry has a unique set of drivers.
- Nonetheless, different, seemingly unrelated lines of business might have latent correlations particularly when they are sensitive to the same external forces.
IBISWorld’s Macro Drivers database includes the top 40 (most statistically important) drivers and links them with the NAICS-based industries they impact.
Key takeaway: This tool facilitates the identification of which LOBs, and specific industries that comprise a LOB, are vulnerable to a specific risk factor. It is also useful for uncovering subsegments within a LOB group that are outliers; i.e., do not behave like other industries in a LOB and are alone in their vulnerability to a particular risk. Many clients have refined LOB categories after identifying latent outliners within a group. Moreover, some clients have used this tool to stress-test or run a scenario to identify what LOBs are most vulnerable to a specific shock…
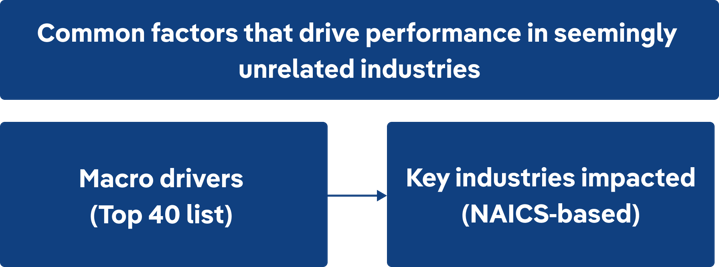
Banks often link their internal performance data with IBISWorld’s risk indicators…
For our hypothetical bank, the process might pan out like this:
- Select which drivers are important to the bank to identify which industries are most impacted.
- In this example, we used ten-year treasury rates from the Macro Drivers Database.
- Use our NAICS mapping table to import selected IBISWorld risk indicators from our EWS.
- Integrate these with bank key performance indicators; in this example loan exposures.
The result is a simple heat map…
- Most bank clients will employ many more IBISWorld risk indicators or even data from other vendors and/or regulatory agencies.
- They are also likely to import other bank specific data such as delinquencies and key financial ratios.
Key takeaway: Constructing a useful heat map necessitates merging key risk indicators with a bank’s key performance indicators by virtue of a NAICS concordance. This process helps determine your priorities.
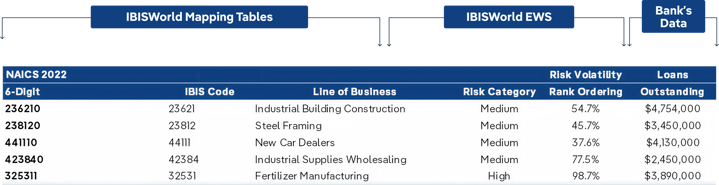
Detecting shocks that resonate along the supply chain…
Mapping supply chain risk has become increasingly challenging and is often a point of contention with regulators and a bank’s internal (and external) audit teams.
Identifying secondary or indirect impacts of a particular shock requires a unique brand of mapping tables. IBISWorld’s proprietary Supply Chain Database provides such a facility. (Readers may wish to consult an IBISWorld client testimonial that describes this process.)
The Supply Chain tool includes top suppliers (upstream industries) and key markets (downstream or buyer industries).
Extending the analysis to include indirect exposures up and down the supply chain…
Let’s build on our example of a hypothetical bank assessing its risk exposure to ten-year treasury rates.
Here, using our Supply Chain Tool and the associated mapping tables, a significant loan exposure was discovered for Construction Machinery Manufacturing by virtue of its link as a supplier to Industrial Building Construction.
For Steel Framing, the bank had an upstream exposure to Metal Wholesaling and a downstream exposure to Apartment/Condo Construction.
Incorporating key risk metrics from IBISWorld’s EWS yielded some alarming results. The bank’s sizable indirect exposure to Metal Wholesaling was at risk!
This is how a properly engineered “Heat Map” works! Even our smallest bank clients follow this method, simply utilizing linked spreadsheets…
Key takeaway: Without investigating the forces that resonate along the supply chain, a bank may not identify significant latent risks, thus underestimating its risk appetite. They might soon face a “matter requiring attention”.
For many banks state and local footprints require analysis…
It is well known that economic performance varies greatly from region to region, state to state, and even within a state, MSA to MSA. Even certain industries are comparatively more sensitive to local rather than national forces. Construction, both commercial and residential, and retail, are highly dependent on nearby traffic.
Further, smaller banks are by nature concentrated locally. Even many regional banks have pockets of business that are heavily concentrated geographically. This necessitates taking a much closer flyover to gain greater insights on likely problem areas in a bank’s footprint.
In our example, our hypothetical bank needs to dig further into its exposure in the Metal Wholesaling industry. From IBISWorld’s website, the business concentration visual is telling.

Downloading IBISWorld data and plotting it against the bank’s write-offs yields:
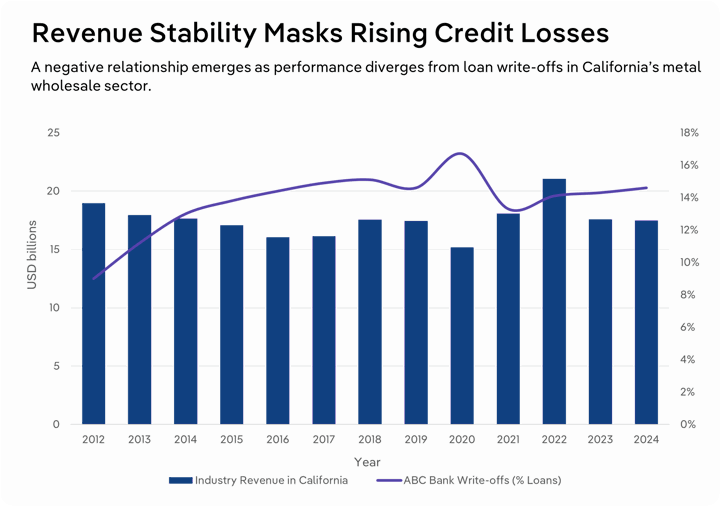
As is the case with many of their peers, the bank’s models and heat maps didn’t pick this up! A negative relationship between industry revenue and bank losses, though not necessarily “statistically” significant, is visually apparent.
We find it apropos to quote Sam Savage’s remarkable book published during the Great Recession. Incidentally, we strongly suggest you purchase multiple copies of the book and gift them to your quants or better yet, your regulators! [Sam Savage, “The Flaw of Averages: Why We Underestimate Risk in the Face of Uncertainty,” John Wiley & Sons, Inc., 2009]
In planning for the future, uncertain outcomes are often replaced with single, so-called average numbers. This leads to a class of systematic errors that I call the Flaw of Averages, which explains among other things why forecasts are always wrong. After all, the Mississippi River is only 3 feet deep, on average, so how big a flood threat can it be?
Key takeaway: There are times when a picture tells a story not easily revealed by historical correlations alone. Unique shocks tend to bring out the worst in models.
The next exercise for our imaginary bank is to download IBISWorld’s county-level data from ibisworld.com and integrate it with the bank’s key performance indicators.
This process can provide considerable insights on where to trim back exposures over time, and where to focus new lending initiatives.
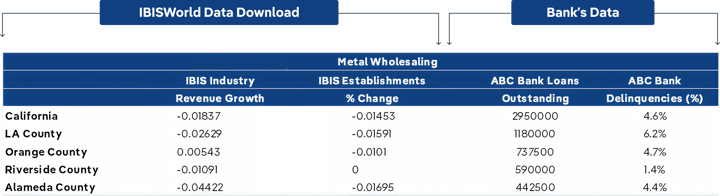
Key takeaway: For smaller banks, and even many regional banks, drilling down to a state and even a county level is imperative. Local economic and financial conditions can vary greatly from national averages, and even state-to-state or within states.
Integrating IBISWorld’s Financial Ratio data for benchmarking…
Many IBISWorld clients have availed themselves of IBISWorld’s financial ratio data to benchmark LOBs or individual obligors against an industry’s financial performance. These figures are sourced from the IRS Statistics of Income (SOI) Tax data and the US Census Bureau. For further information, consult here.
As an illustration, we’ll use two financial ratios by asset size of the hypothetical ABC Bank’s customers. For this example, we’ll use EBIT/Interest as a coverage ratio and Sales/Receivables as a liquidity ratio. Here, Riverside County customers are in the 500K-1M asset size range while the remaining counties are in the 1-5M category.
The next step is for ABC Bank to integrate and compare their actual ratios with IBISWorld’s benchmarks. In our example, only LA county has one less than appealing; 1.7 for the cover ratio.
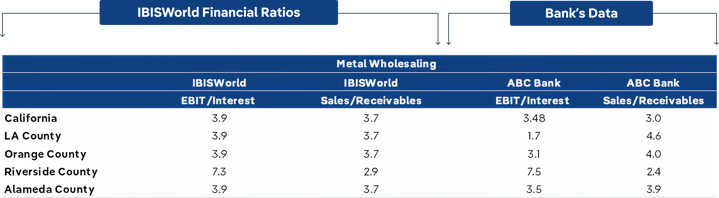
Key takeaway: Comparing IBISWorld’s financial ratios with your own internal data provides additional insight, helping to flag potentially problematic loans. This can be particularly useful when interest rate and liquidity risks loom.
Client dashboards and application programming interface (API): the emerging industry standard…
Many of our commercial banking clients are accessing our data (numerical, text, tables, charts) via an API and then building custom CRM dashboards with our assistance. What was the new wave just a couple of years ago is fast becoming an industry best practice. This is true for banks, big and small. The age of manually cutting and pasting is rapidly coming to a close.
The process is automated and involves the integration of IBISWorld data/information as well as other external sources with a bank’s proprietary performance indicators. Dashboards are constructed using visual analytics platforms such as Tableau or PowerBI.
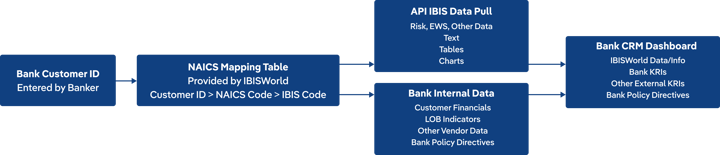
The procedure itself is sequential:
- Bankers enter a customer ID to initiate the procedure.
- IBISWorld’s NAICS mapping tables provide the infrastructure to link various internal and external data sources.
- API is used to access/refresh IBISWorld data/info. (IBIS staff assists with data selection and API tech support.)
- The client combines IBIS and bank data.
- The client’s CRM dashboard has a mix of data, text, and visuals as determined by the bank.
ALERT: In addition to automation and a “connecting of the dots” data integration, this process has the added benefit of communicating policy directives, with supporting data, to the field. It defines the Holy Grail of credit portfolio management.
Part III: Epilogue
We live in a time when daily headlines seem to spawn a new bout of uncertainty and indecisiveness. Vexed by the surfeit of day-to-day news, most of which is noise, the ultimate challenge is to determine which forces impose serious risks to your organization. Without establishing well-defined priorities, strategists often become befuddled, and tacticians (empowered to operationalize plans) can meander aimlessly.
Our objective was cutting through the cacophony. We have focused on analyzing two major sources of credit risk, tariffs/trade policy and America’s debt burden, and have woven them into a stepwise, decision-support framework applying conventional, industry standard tools.
Key takeaway: There’s a huge difference between news headlines or an “experts” op-ed and true signals with material impacts. Even more so, translating signals to action requires connecting real data, and trustworthy KRIs, with a bank’s LOBs.
There are two issues with key takeaways readers should remember:
- First, although there will be times when apparent progress is being made in the tariff and trade policy arena, the situation will remain quite fluid. For instance, the details behind the Japan/US and EU/US “tariff for investment” deals are ambiguous in terms of how they will impact America, and amorphous regarding what forms investment inflows may take.
- The second issue is that America’s debt is far more complex than most pundits believe. Our total debt presents a far more menacing risk than tariffs and trade policy. Even if the trade issue magically evaporated, the financial ramifications of America’s growing debt would live on, with solutions remaining economically and politically elusive.
So, don’t be fooled if the climate appears to improve. Businesses and banks need to be alert, or as Andrew Grove framed it, “Complacency breeds failure. Only the paranoid survive”. [Consult: Andrew S. Grove, “Only the Paranoid Survive: How to Exploit the Crisis Points That Challenge Every Company,” Crown Publishing, 1999]
Finally, our storyline incorporated many factors that have, in our opinion, been either undervalued, or simply ignored. And many of these forces have data sources that are easily accessible, are of relatively high frequency, and can serve as forward-looking, early warning indicators!
Nonetheless, this study is not exhaustive by any means. There are many other topics on our clients’ radar screens and are worthy of further consideration, including:
- The surging costs of property insurance, both commercial and residential;
- Immigration and the status of H-1B visas;
- Labor market stress;
- The seemingly unstoppable proliferation of AI;
- Cable cutting, the entertainment and communications industries (new linkages blurring of the lines of industry definitions themselves);
- Rapidly evolving payment systems (real time payments, stablecoins, etc.); and
- The fate of America’s energy sector.
Let us know what you think!
For further information, questions or comments, please feel free to contact your IBISWorld representative. Or email us at: commercial-banking@ibisworld.com.
Thanks,
Rick, Rob, Kent and Dev
About the authors
Dr. Rick Buczynski is IBISWorld’s SVP/Chief Economist responsible for developing a wide range of risk management tools including the Company’s Industry Early Warning and Concentration Risk Systems. Rick has published numerous articles on risk management and how economic forces influence credit risk. Currently he assists clients in building early warning and obligor scorecard/grading systems used for both risk mitigation and business development. Prior to joining IBISWorld, Rick spent over 20 years with Nobel Laureate in Economics Professor Lawrence Klein’s team of researchers at Wharton Econometrics (WEFA).
Kent Kirby is a retired banker with over 39 years of experience in all aspects of commercial banking: lending, loan review, back-room operations, credit administration, portfolio management and analytics, and credit policy. He is currently serving as a senior consultant at Abrigo, a banking software and consulting company. In this capacity, Kirby assists financial institutions of all sizes in the review and enhancement of commercial lending and loan review activities, particularly as institutions migrate to an automated solution to meet their needs.
Robert Miles is a Data Scientist leading various projects in IBISWorld's internal Data Analytics team. Robert's work focuses on building scalable forecasting models and producing data warehousing solutions and new data-centric product solutions. This work coincides with IBISWorld's Risk Products, and Robert assists in supporting existing tools and developing new tools for client integrations in this space. Prior to his analytics role, Robert led research groups internally with broad industry coverage across manufacturing, retailing, and wholesaling.
Dev Strischek is principal of Devon Risk Advisory Group and engages in consulting, speaking and training on a wide range of risk, credit, and lending topics. and has authored many articles regarding these issues. As former senior credit policy officer at SunTrust Bank, Atlanta, he was responsible for developing, implementing, and administering credit policies for SunTrust's wholesale lines of business--commercial, commercial real estate, corporate investment banking, capital markets, business banking and private wealth management. Dev serves as an instructor in the ABA’s Stonier Graduate School of Banking and its Commercial Lending School. He has also represented the banking industry on the Private Company Council of the Financial Accounting Standards Board where the PCC reviews proposed and existing generally accepted accounting principles and recommends changes to GAAP that accommodate the needs of privately held companies.